Filters: Tags: Pacific County (X)
111 results (68ms)|
Filters
Date Range
Types Contacts
Categories Tag Types Tag Schemes |
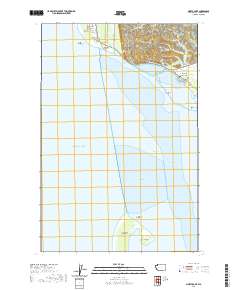
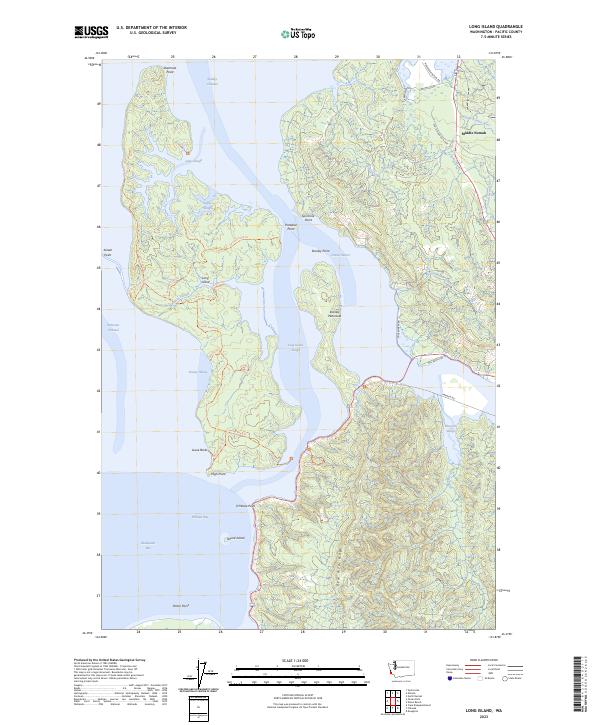
Layered geospatial PDF 7.5 Minute Quadrangle Map. Layers of geospatial data include orthoimagery, roads, grids, geographic names, elevation contours, hydrography, and other selected map features. This map is derived from GIS (geospatial information system) data. It represents a repackaging of GIS data in traditional map form, not creation of new information. The geospatial data in this map are from selected National Map data holdings and other government sources.
Layered geospatial PDF 7.5 Minute Quadrangle Map. Layers of geospatial data include orthoimagery, roads, grids, geographic names, elevation contours, hydrography, and other selected map features. This map is derived from GIS (geospatial information system) data. It represents a repackaging of GIS data in traditional map form, not creation of new information. The geospatial data in this map are from selected National Map data holdings and other government sources.
This portion of the USGS data release presents topography data collected during surveys performed in the Columbia River littoral cell, Washington and Oregon, in 2014 (USGS Field Activity Number 2014-631-FA). Topographic profiles were collected by walking along survey lines with global navigation satellite system (GNSS) receivers mounted on backpacks. Prior to data collection, vertical distances between the GNSS antennas and the ground were measured using a tape measure. Hand-held data collectors were used to log raw data and display navigational information allowing surveyors to navigate survey lines spaced at 100- to 1,000-m intervals along the beach. Profiles were surveyed from the landward edge of the study area...
Categories: Data;
Types: Map Service,
OGC WFS Layer,
OGC WMS Layer,
OGC WMS Service;
Tags: Bathymetry and Elevation,
CMHRP,
Clatsop County,
Coastal and Marine Hazards and Resources Program,
Columbia River,
This portion of the USGS data release presents bathymetry data collected during surveys performed in the Columbia River littoral cell, Washington and Oregon in 2015 (USGS Field Activity Number 2015-647-FA). Bathymetry data were collected using four personal watercraft (PWCs) equipped with single-beam sonar systems and global navigation satellite system (GNSS) receivers. The sonar systems consisted of an Odom Echotrac CV-100 single-beam echosounder and 200 kHz transducer with a 9 degree beam angle. Raw acoustic backscatter returns were digitized by the echosounder with a vertical resolution of 1.25 cm. Depths from the echosounders were computed using sound velocity profiles measured using a YSI CastAway CTD during...
Categories: Data;
Types: Map Service,
OGC WFS Layer,
OGC WMS Layer,
OGC WMS Service;
Tags: Bathymetry and Elevation,
CMHRP,
Clatsop County,
Coastal and Marine Hazards and Resources Program,
Columbia River,
This portion of the USGS data release presents bathymetry data collected during surveys performed in the Columbia River littoral cell, Washington and Oregon in 2019 (USGS Field Activity Number 2019-632-FA). Bathymetry data were collected using four personal watercraft (PWCs) equipped with single-beam sonar systems and global navigation satellite system (GNSS) receivers. The sonar systems consisted of an Odom Echotrac CV-100 single-beam echosounder and 200 kHz transducer with a 9 degree beam angle. Raw acoustic backscatter returns were digitized by the echosounder with a vertical resolution of 1.25 cm. Depths from the echosounders were computed using sound velocity profiles measured using a YSI CastAway CTD during...
Categories: Data;
Types: Map Service,
OGC WFS Layer,
OGC WMS Layer,
OGC WMS Service;
Tags: Bathymetry and Elevation,
CMHRP,
Clatsop County,
Coastal and Marine Hazards and Resources Program,
Columbia River,
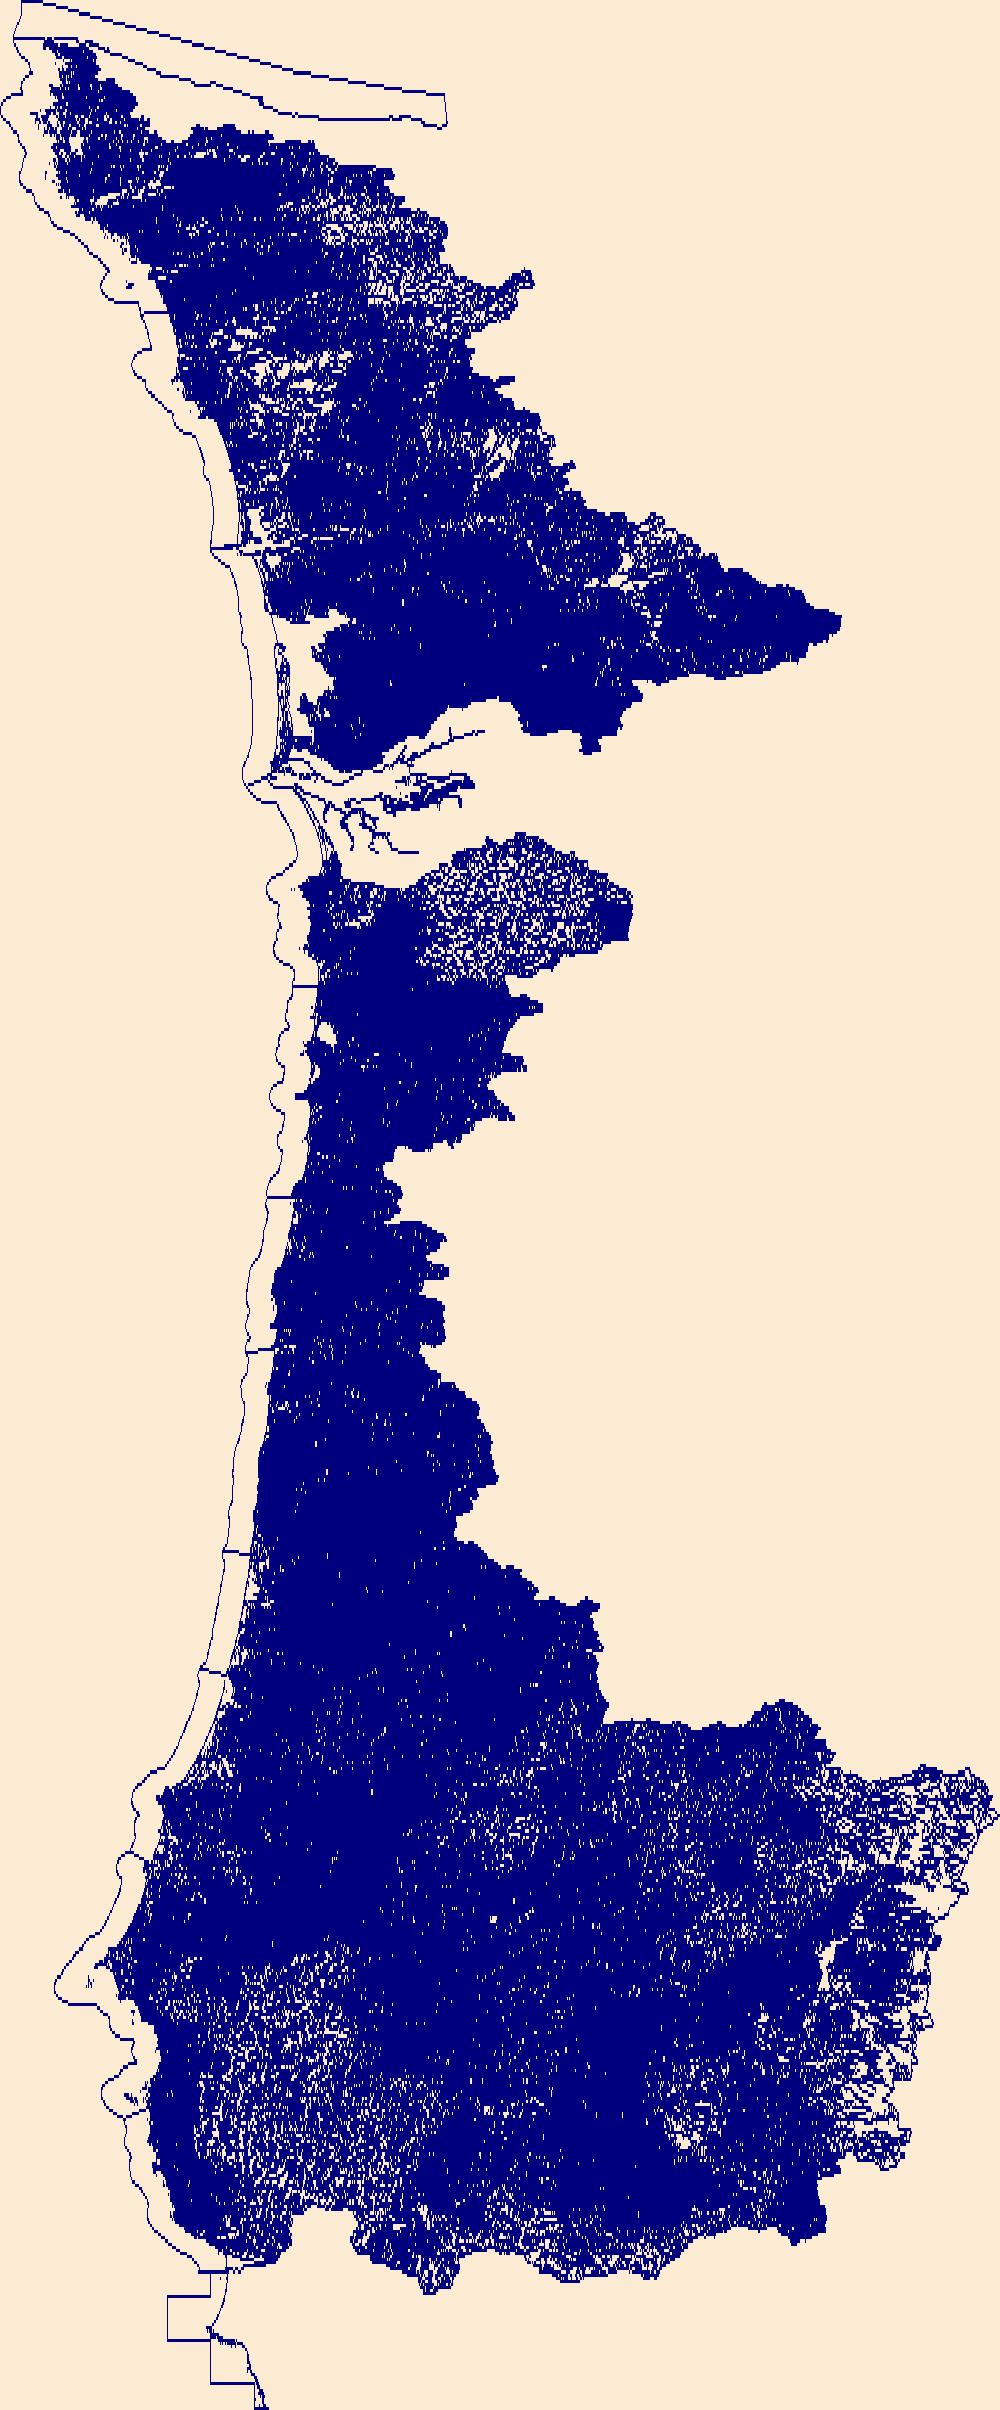
The High Resolution National Hydrography Dataset Plus (NHDPlus HR) is an integrated set of geospatial data layers, including the best available National Hydrography Dataset (NHD), the 10-meter 3D Elevation Program Digital Elevation Model (3DEP DEM), and the National Watershed Boundary Dataset (WBD). The NHDPlus HR combines the NHD, 3DEP DEMs, and WBD to create a stream network with linear referencing, feature naming, "value added attributes" (VAAs), elevation-derived catchments, and other features for hydrologic data analysis. The stream network with linear referencing is a system of data relationships applied to hydrographic systems so that one stream reach "flows" into another and "events" can be tied to and traced...
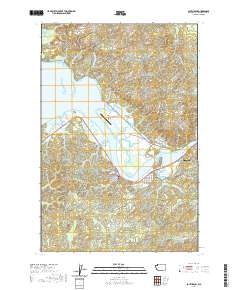
Layered geospatial PDF 7.5 Minute Quadrangle Map. Layers of geospatial data include orthoimagery, roads, grids, geographic names, elevation contours, hydrography, and other selected map features. This map is derived from GIS (geospatial information system) data. It represents a repackaging of GIS data in traditional map form, not creation of new information. The geospatial data in this map are from selected National Map data holdings and other government sources.
Layered geospatial PDF 7.5 Minute Quadrangle Map. Layers of geospatial data include orthoimagery, roads, grids, geographic names, elevation contours, hydrography, and other selected map features. This map is derived from GIS (geospatial information system) data. It represents a repackaging of GIS data in traditional map form, not creation of new information. The geospatial data in this map are from selected National Map data holdings and other government sources.
This portion of the data release presents high-resolution orthomosaic images of the ocean beach at Fort Stevens State Park, OR, and Benson Beach at Cape Disappointment State Park, WA. The orthomosaics have resolutions of 5 centimeters per pixel and were derived from structure-from-motion (SfM) processing of aerial imagery collected with unoccupied aerial systems (UAS) during low tide surveys on 22 and 23 July 2021. The raw imagery used to create the orthomosaics was acquired with a UAS fitted with a Ricoh GR II digital camera featuring a global shutter. The UAS was flown on pre-programmed autonomous flight lines spaced to provide approximately 70 percent overlap between images from adjacent lines. The camera was...
Categories: Data;
Tags: Bathymetry and Elevation,
Benson Beach,
CHMRP,
Cape Disappointment,
Clatsop County,
This portion of the USGS data release presents topography data collected during surveys performed in the Columbia River littoral cell, Washington and Oregon, in 2016 (USGS Field Activity Number 2016-663-FA). Topographic profiles were collected by walking along survey lines with global navigation satellite system (GNSS) receivers mounted on backpacks. Prior to data collection, vertical distances between the GNSS antennas and the ground were measured using a tape measure. Hand-held data collectors were used to log raw data and display navigational information allowing surveyors to navigate survey lines spaced at 100- to 1000-m intervals along the beach. Profiles were surveyed from the landward edge of the study area...
Categories: Data;
Types: Map Service,
OGC WFS Layer,
OGC WMS Layer,
OGC WMS Service;
Tags: Bathymetry and Elevation,
CMHRP,
Clatsop County,
Coastal and Marine Hazards and Resources Program,
Columbia River,
This portion of the USGS data release presents topography data collected during surveys performed in the Columbia River littoral cell, Washington and Oregon, in 2023 (USGS Field Activity Number 2023-644-FA). Topographic profiles were collected by walking along survey lines with global navigation satellite system (GNSS) receivers mounted on backpacks. Prior to data collection, vertical distances between the GNSS antennas and the ground were measured using a tape measure. Hand-held data collectors were used to log raw data and display navigational information allowing surveyors to navigate survey lines spaced at 100- to 1000-m intervals along the beach. Profiles were surveyed from the landward edge of the study area...
Categories: Data;
Types: Map Service,
OGC WFS Layer,
OGC WMS Layer,
OGC WMS Service;
Tags: Bathymetry and Elevation,
CMHRP,
Clatsop County,
Coastal and Marine Hazards and Resources Program,
Columbia River,
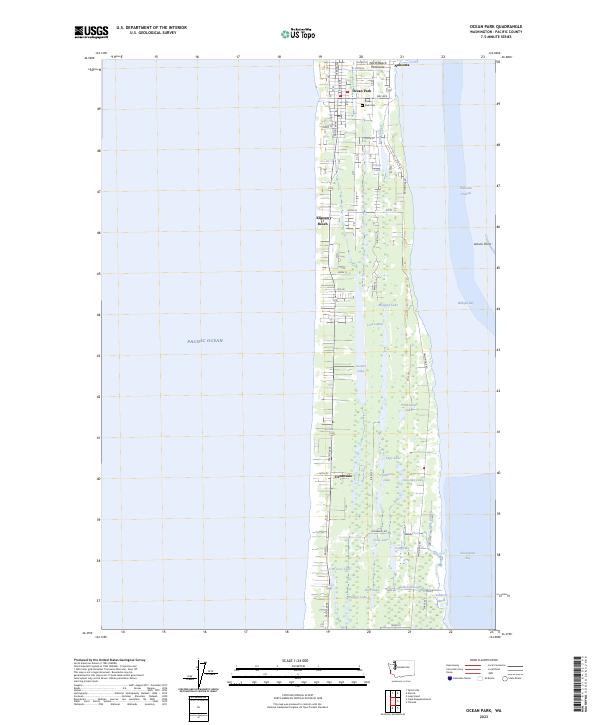
Layered geospatial PDF 7.5 Minute Quadrangle Map. Layers of geospatial data include orthoimagery, roads, grids, geographic names, elevation contours, hydrography, and other selected map features. This map is derived from GIS (geospatial information system) data. It represents a repackaging of GIS data in traditional map form, not creation of new information. The geospatial data in this map are from selected National Map data holdings and other government sources.
Layered geospatial PDF 7.5 Minute Quadrangle Map. Layers of geospatial data include orthoimagery, roads, grids, geographic names, elevation contours, hydrography, and other selected map features. This map is derived from GIS (geospatial information system) data. It represents a repackaging of GIS data in traditional map form, not creation of new information. The geospatial data in this map are from selected National Map data holdings and other government sources.
Layered geospatial PDF 7.5 Minute Quadrangle Map. Layers of geospatial data include orthoimagery, roads, grids, geographic names, elevation contours, hydrography, and other selected map features. This map is derived from GIS (geospatial information system) data. It represents a repackaging of GIS data in traditional map form, not creation of new information. The geospatial data in this map are from selected National Map data holdings and other government sources.
Layered geospatial PDF 7.5 Minute Quadrangle Map. Layers of geospatial data include orthoimagery, roads, grids, geographic names, elevation contours, hydrography, and other selected map features. This map is derived from GIS (geospatial information system) data. It represents a repackaging of GIS data in traditional map form, not creation of new information. The geospatial data in this map are from selected National Map data holdings and other government sources.
Layered geospatial PDF 7.5 Minute Quadrangle Map. Layers of geospatial data include orthoimagery, roads, grids, geographic names, elevation contours, hydrography, and other selected map features. This map is derived from GIS (geospatial information system) data. It represents a repackaging of GIS data in traditional map form, not creation of new information. The geospatial data in this map are from selected National Map data holdings and other government sources.
Layered geospatial PDF 7.5 Minute Quadrangle Map. Layers of geospatial data include orthoimagery, roads, grids, geographic names, elevation contours, hydrography, and other selected map features. This map is derived from GIS (geospatial information system) data. It represents a repackaging of GIS data in traditional map form, not creation of new information. The geospatial data in this map are from selected National Map data holdings and other government sources.
Layers of geospatial data include contours, boundaries, land cover, hydrography, roads, transportation, geographic names, structures, and other selected map features.
Types: Citation;
Tags: 7.5 x 7.5 minute,
7.5 x 7.5 minute,
Clatsop County,
Combined Vector,
Combined Vector,
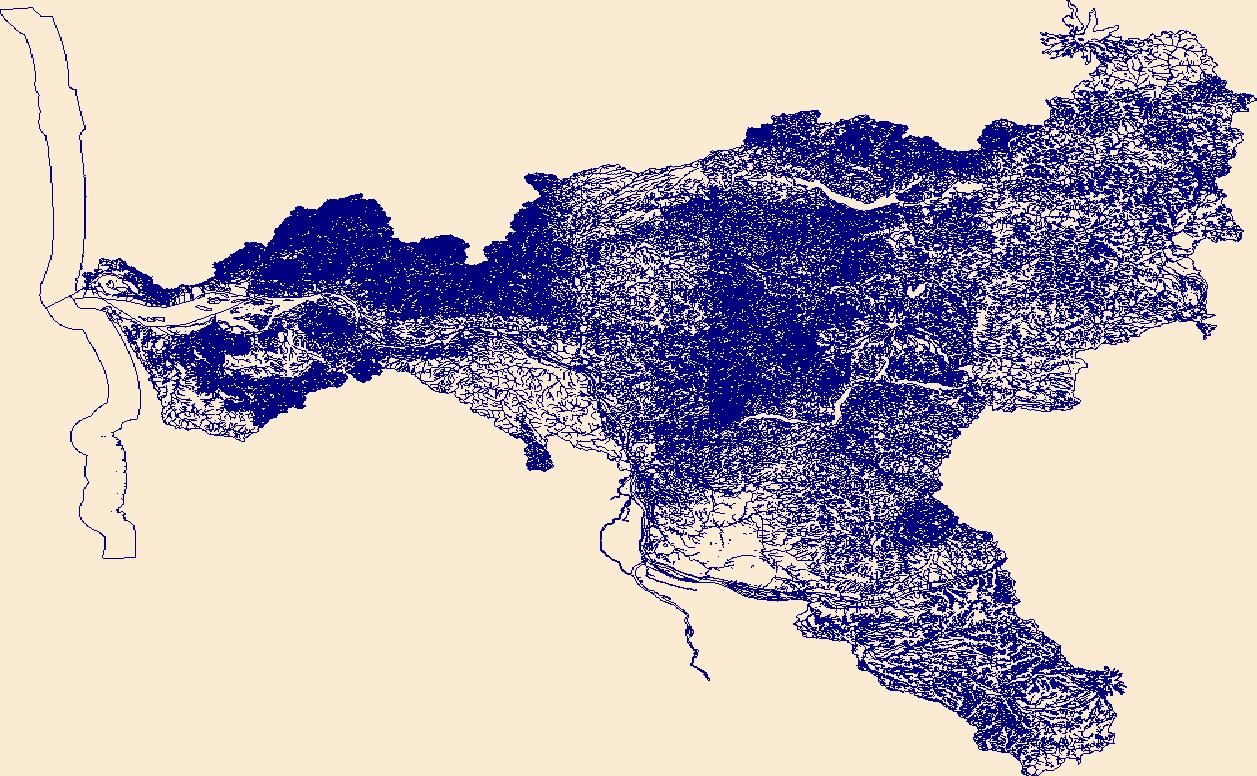
The High Resolution National Hydrography Dataset Plus (NHDPlus HR) is an integrated set of geospatial data layers, including the best available National Hydrography Dataset (NHD), the 10-meter 3D Elevation Program Digital Elevation Model (3DEP DEM), and the National Watershed Boundary Dataset (WBD). The NHDPlus HR combines the NHD, 3DEP DEMs, and WBD to create a stream network with linear referencing, feature naming, "value added attributes" (VAAs), elevation-derived catchments, and other features for hydrologic data analysis. The stream network with linear referencing is a system of data relationships applied to hydrographic systems so that one stream reach "flows" into another and "events" can be tied to and traced...
Layered geospatial PDF 7.5 Minute Quadrangle Map. Layers of geospatial data include orthoimagery, roads, grids, geographic names, elevation contours, hydrography, and other selected map features. This map is derived from GIS (geospatial information system) data. It represents a repackaging of GIS data in traditional map form, not creation of new information. The geospatial data in this map are from selected National Map data holdings and other government sources.
|

|
