Filters: Tags: Pontotoc County (X)
154 results (289ms)|
Filters
Date Range
Types Contacts
Categories Tag Types Tag Schemes |
This dataset represents aerial photography of the Natchez Trace Parkway that was taken in late September and early October of 2004. Images were acquired during leaf-on conditions as required by the National Park Service (NPS) to accomplish their ground-based vegetation classification. Nearly 400 aerial photography frames were scanned and orthorectified to generate digital orthophoto quarter quads (DOQQs). These were cut to match existing DOQQs creating a total of 235 DOQQs for the entire 715 km long Parkway. For ease of use, the DOQQs were grouped into 11 mosaics, each covering a section of the Parkway. At the request of the NPS, each mosaic was divided into ten tiles to allow for efficient loading on less robust...
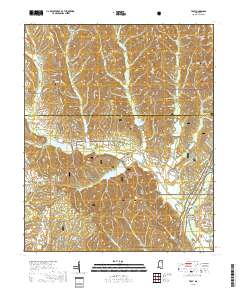
Layered geospatial PDF 7.5 Minute Quadrangle Map. Layers of geospatial data include orthoimagery, roads, grids, geographic names, elevation contours, hydrography, and other selected map features. This map is derived from GIS (geospatial information system) data. It represents a repackaging of GIS data in traditional map form, not creation of new information. The geospatial data in this map are from selected National Map data holdings and other government sources.
Layered geospatial PDF 7.5 Minute Quadrangle Map. Layers of geospatial data include orthoimagery, roads, grids, geographic names, elevation contours, hydrography, and other selected map features. This map is derived from GIS (geospatial information system) data. It represents a repackaging of GIS data in traditional map form, not creation of new information. The geospatial data in this map are from selected National Map data holdings and other government sources.
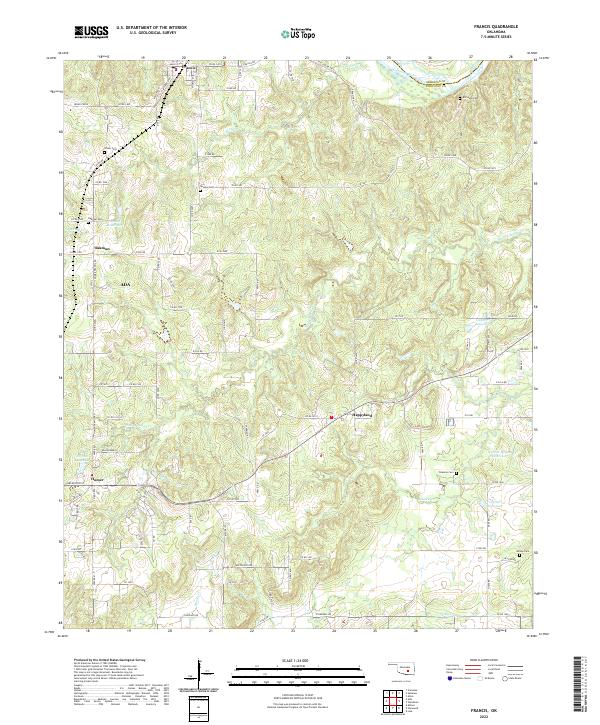
Layered geospatial PDF 7.5 Minute Quadrangle Map. Layers of geospatial data include orthoimagery, roads, grids, geographic names, elevation contours, hydrography, and other selected map features. This map is derived from GIS (geospatial information system) data. It represents a repackaging of GIS data in traditional map form, not creation of new information. The geospatial data in this map are from selected National Map data holdings and other government sources.
The U.S. Geological Survey (USGS) works closely with the Mississippi Department of Transportation (MDOT) to provide information to be used by the MDOT for design of highway-drainage structures. MDOT spends millions of dollars annually for highway construction. Streamflow records, hydrologic analyses of basins, and hydraulic analyses of flooding potential at proposed highway crossings help the MDOT to make more informed decisions on the use of highway construction funding. Flood-frequency and hydraulic characteristics at highway crossings are determined from historical flood-elevation data recovered by the USGS, cross-section data, and correlations with data from nearby gaging stations. Additional streamflow data...
Categories: Data;
Types: Map Service,
OGC WFS Layer,
OGC WMS Layer,
OGC WMS Service;
Tags: Harrison County,
Hinds County,
Holmes County,
Hydrology,
Madison County,
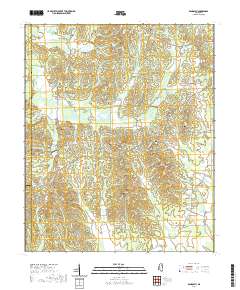
This 1:24,000-scale geologic map includes new geologic mapping as well as compilation and revision of previous geologic maps. Field investigations were conducted from 2009-2011, while also mapping and investigating the geology and hydrology of the Chickasaw National Recreation Area, west of the map area. The Fittstown quadrangle is in the northeastern part of the Arbuckle Mountains. The Arbuckle Mountains are composed of a thick sequence of Paleozoic sedimentary rocks that overlie Early Cambrian and Precambrian igneous rocks; these latter rocks are not exposed in the quadrangle. From middle to late Pennsylvanian time, the Arbuckle Mountains region was folded, faulted, and uplifted. Periods of erosion followed these...
Types: Citation;
Tags: Arbuckle Mountains,
Arbuckle-Simpson aquifer,
Fittstown,
Franks fault zone,
Franks graben,
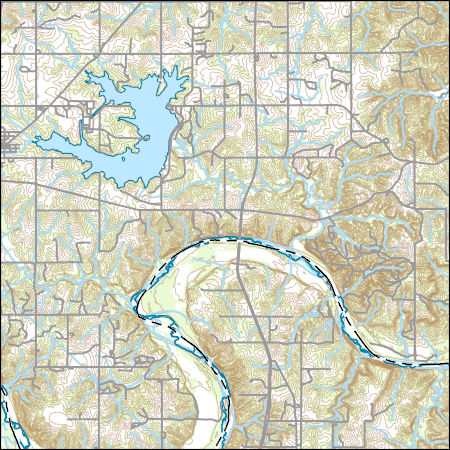
Layers of geospatial data include contours, boundaries, land cover, hydrography, roads, transportation, geographic names, structures, and other selected map features.
Layers of geospatial data include contours, boundaries, land cover, hydrography, roads, transportation, geographic names, structures, and other selected map features.
Types: Citation;
Tags: 7.5 x 7.5 minute,
7_5_Min,
Combined Vector,
Combined Vector,
Combined Vector,
This dataset consists of linear features depicting the main road running through the Natchez Trace Parkway and other roads visible on the color infrared photography. The Parkway is a 715-km roadway that historically connected the southern portions of the Mississippi River to the salt licks in central Tennessee. The vector data represent the roadway of the Parkway at an approximate along-track (parallel and perpendicular to the road) with a spatial accuracy of about 3 meters or less.
This dataset consists of a map depicting the distribution of sweetgum-oak mixed forests along the Natchez Trace Parkway. Ground-based vegetation classification was provided by the National Park Service and mapped by the U.S. Geological Survey, National Wetlands Research Center. In the final version of "Mapping the Natchez Trace Parkway," the Sweetgum-Oak class was merged with the Sweetgum class because most of the time it co-occurred with the Sweetgum field sites.
This dataset defines the symbology for the landcover map of the Natchez Trace Parkway. The map shows the distribution of 18 landcover classes based on the National Vegetation Classification Standard. Ground-based vegetation classification was provided by National Park Service (NPS). The mapping output and layer delineate grasses, road-developed areas, scrub-shrub, shrubland, plantation, water bodies, areas of white oak, oak, pine-oak, pine-cedar, pine-sweetgum, sweetgum (including sweetgum-oak), scattered trees, swamp forest, irregular classes, aquatic vegetation, invasive species, canopy gaps, and clouds. Mapped classes that have been digitized are noted with an asterisk (*) in the legend.
Layered geospatial PDF 7.5 Minute Quadrangle Map. Layers of geospatial data include orthoimagery, roads, grids, geographic names, elevation contours, hydrography, and other selected map features. This map is derived from GIS (geospatial information system) data. It represents a repackaging of GIS data in traditional map form, not creation of new information. The geospatial data in this map are from selected National Map data holdings and other government sources.
Layered geospatial PDF 7.5 Minute Quadrangle Map. Layers of geospatial data include orthoimagery, roads, grids, geographic names, elevation contours, hydrography, and other selected map features. This map is derived from GIS (geospatial information system) data. It represents a repackaging of GIS data in traditional map form, not creation of new information. The geospatial data in this map are from selected National Map data holdings and other government sources.
Layered geospatial PDF 7.5 Minute Quadrangle Map. Layers of geospatial data include orthoimagery, roads, grids, geographic names, elevation contours, hydrography, and other selected map features. This map is derived from GIS (geospatial information system) data. It represents a repackaging of GIS data in traditional map form, not creation of new information. The geospatial data in this map are from selected National Map data holdings and other government sources.
Layered geospatial PDF 7.5 Minute Quadrangle Map. Layers of geospatial data include orthoimagery, roads, grids, geographic names, elevation contours, hydrography, and other selected map features. This map is derived from GIS (geospatial information system) data. It represents a repackaging of GIS data in traditional map form, not creation of new information. The geospatial data in this map are from selected National Map data holdings and other government sources.
Layers of geospatial data include contours, boundaries, land cover, hydrography, roads, transportation, geographic names, structures, and other selected map features.
Layers of geospatial data include contours, boundaries, land cover, hydrography, roads, transportation, geographic names, structures, and other selected map features.
Types: Citation;
Tags: 7.5 x 7.5 minute,
7_5_Min,
Combined Vector,
Combined Vector,
Combined Vector,
Layers of geospatial data include contours, boundaries, land cover, hydrography, roads, transportation, geographic names, structures, and other selected map features.
Types: Citation;
Tags: 7.5 x 7.5 minute,
7_5_Min,
Combined Vector,
Combined Vector,
Combined Vector,
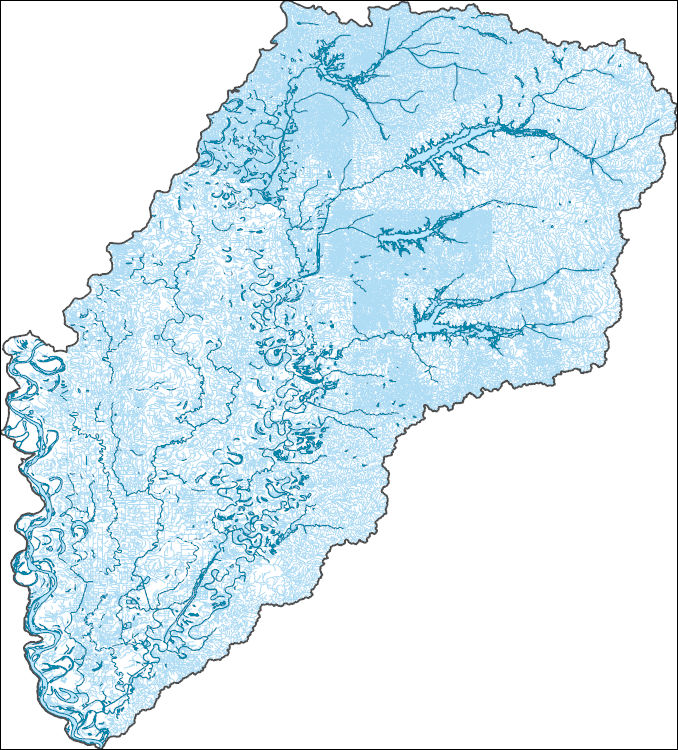
The High Resolution National Hydrography Dataset Plus (NHDPlus HR) is an integrated set of geospatial data layers, including the best available National Hydrography Dataset (NHD), the 10-meter 3D Elevation Program Digital Elevation Model (3DEP DEM), and the National Watershed Boundary Dataset (WBD). The NHDPlus HR combines the NHD, 3DEP DEMs, and WBD to create a stream network with linear referencing, feature naming, "value added attributes" (VAAs), elevation-derived catchments, and other features for hydrologic data analysis. The stream network with linear referencing is a system of data relationships applied to hydrographic systems so that one stream reach "flows" into another and "events" can be tied to and traced...
This dataset consists of a map depicting suspected sites of invasive species along the Natchez Trace Parkway. Four invasive species were manually mapped and aggregated as an invasive species class. Ground-based vegetation classification was provided by the National Park Service and mapped by the U.S. Geological Survey, National Wetlands Research Center.
|

|
