Filters: Tags: Queens County (X)
60 results (41ms)|
Filters
Date Range
Extensions Types Contacts
Categories Tag Types
|
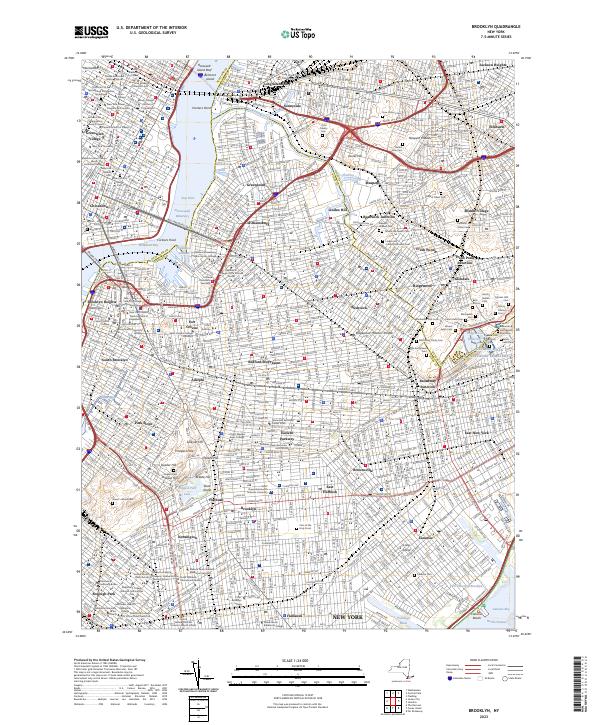
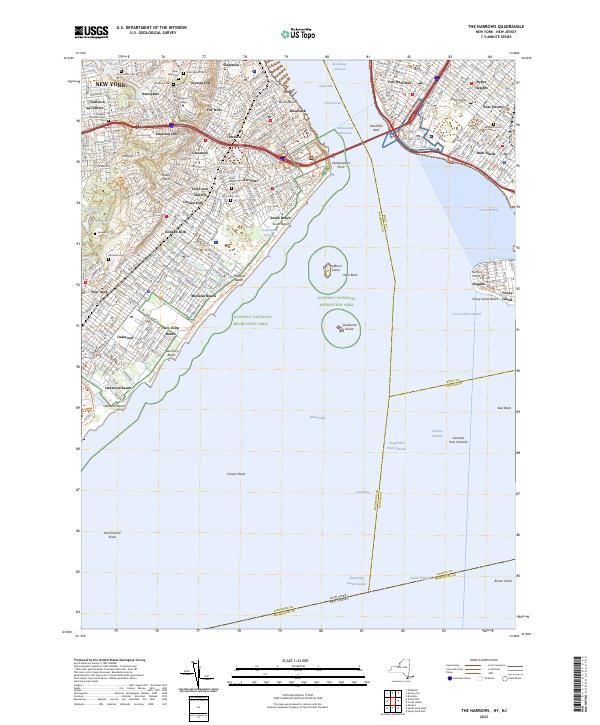
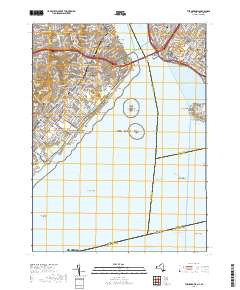
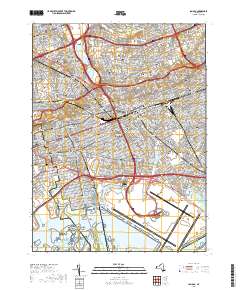
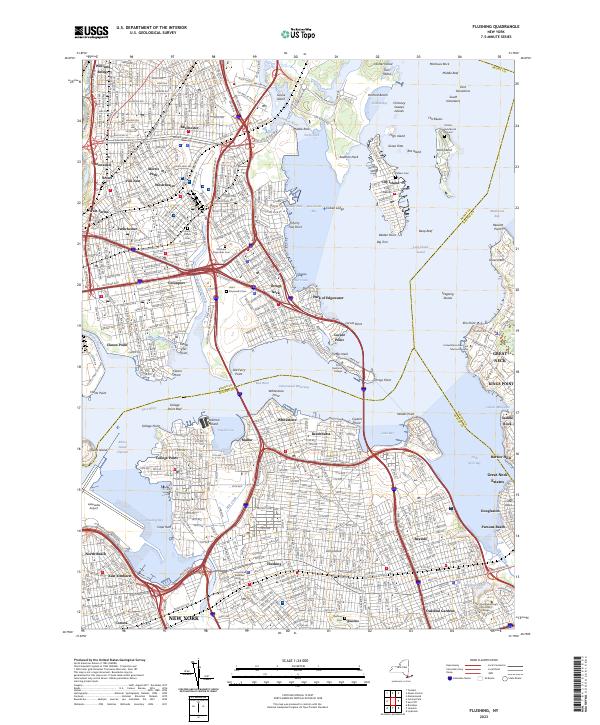
Layered geospatial PDF 7.5 Minute Quadrangle Map. Layers of geospatial data include orthoimagery, roads, grids, geographic names, elevation contours, hydrography, and other selected map features. This map is derived from GIS (geospatial information system) data. It represents a repackaging of GIS data in traditional map form, not creation of new information. The geospatial data in this map are from selected National Map data holdings and other government sources.
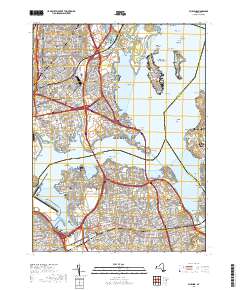
Layered geospatial PDF 7.5 Minute Quadrangle Map. Layers of geospatial data include orthoimagery, roads, grids, geographic names, elevation contours, hydrography, and other selected map features. This map is derived from GIS (geospatial information system) data. It represents a repackaging of GIS data in traditional map form, not creation of new information. The geospatial data in this map are from selected National Map data holdings and other government sources.
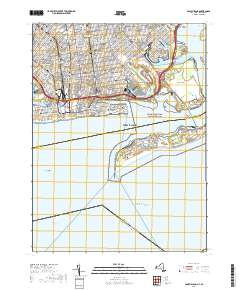
Layered geospatial PDF 7.5 Minute Quadrangle Map. Layers of geospatial data include orthoimagery, roads, grids, geographic names, elevation contours, hydrography, and other selected map features. This map is derived from GIS (geospatial information system) data. It represents a repackaging of GIS data in traditional map form, not creation of new information. The geospatial data in this map are from selected National Map data holdings and other government sources.
This dataset has been archived; it has been superseded by version 3.0 (November 2021) which can be found at https://doi.org/10.5066/P954DLLC . The data contained in this data release support USGS Scientific Investigations Report 2020-5023, "Distribution of selected hydrogeologic characteristics of the upper glacial and Magothy aquifers, Long Island, New York" (Walter and Finkelstein, 2020). This data release contains estimates of aquifer texture describing the Long Island aquifer system. These estimates in total can be considered a model of aquifer texture describing unconsolidated sediments in the following principal units: 1) Upper glacial aquifer, 2) Jameco aquifer, 3) Monmouth Greensand confining unit, and...
This data release contains the output from a Soil-Water-Balance (SWB) model (Westenbroek and others, 2010), used to estimate potential recharge to the Long Island regional aquifer system from 1900-2019. Output data for two SWB simulations are included. The first simulation uses available land-use/land-cover datasets to estimate recharge with changing land use from 1900-2019 (referred to as the post-development simulation). The second simulation assumed a forested, undeveloped (predevelopment simulation) condition across Long Island for the same period. The same soil coverages and time-series climate data were used throughout both simulations. Potential recharge was spatially distributed as gridded output across...
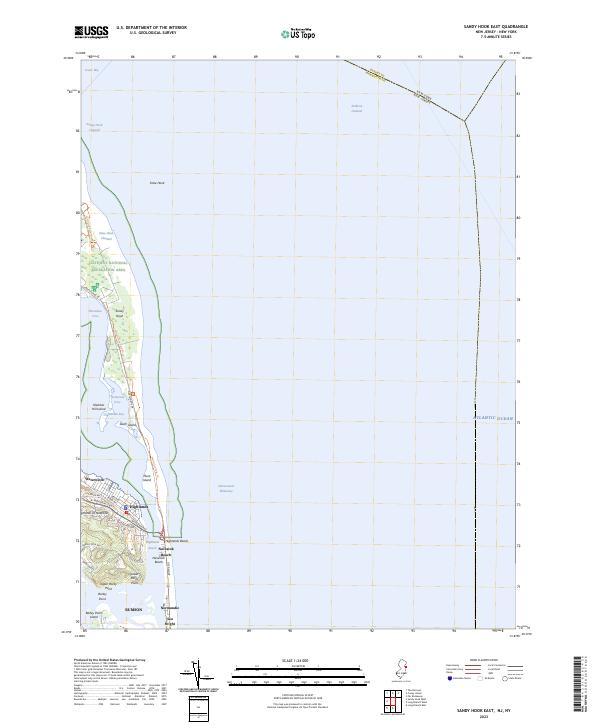
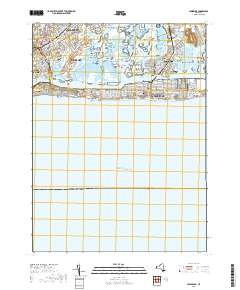
Layered geospatial PDF 7.5 Minute Quadrangle Map. Layers of geospatial data include orthoimagery, roads, grids, geographic names, elevation contours, hydrography, and other selected map features. This map is derived from GIS (geospatial information system) data. It represents a repackaging of GIS data in traditional map form, not creation of new information. The geospatial data in this map are from selected National Map data holdings and other government sources.
Layered geospatial PDF 7.5 Minute Quadrangle Map. Layers of geospatial data include orthoimagery, roads, grids, geographic names, elevation contours, hydrography, and other selected map features. This map is derived from GIS (geospatial information system) data. It represents a repackaging of GIS data in traditional map form, not creation of new information. The geospatial data in this map are from selected National Map data holdings and other government sources.
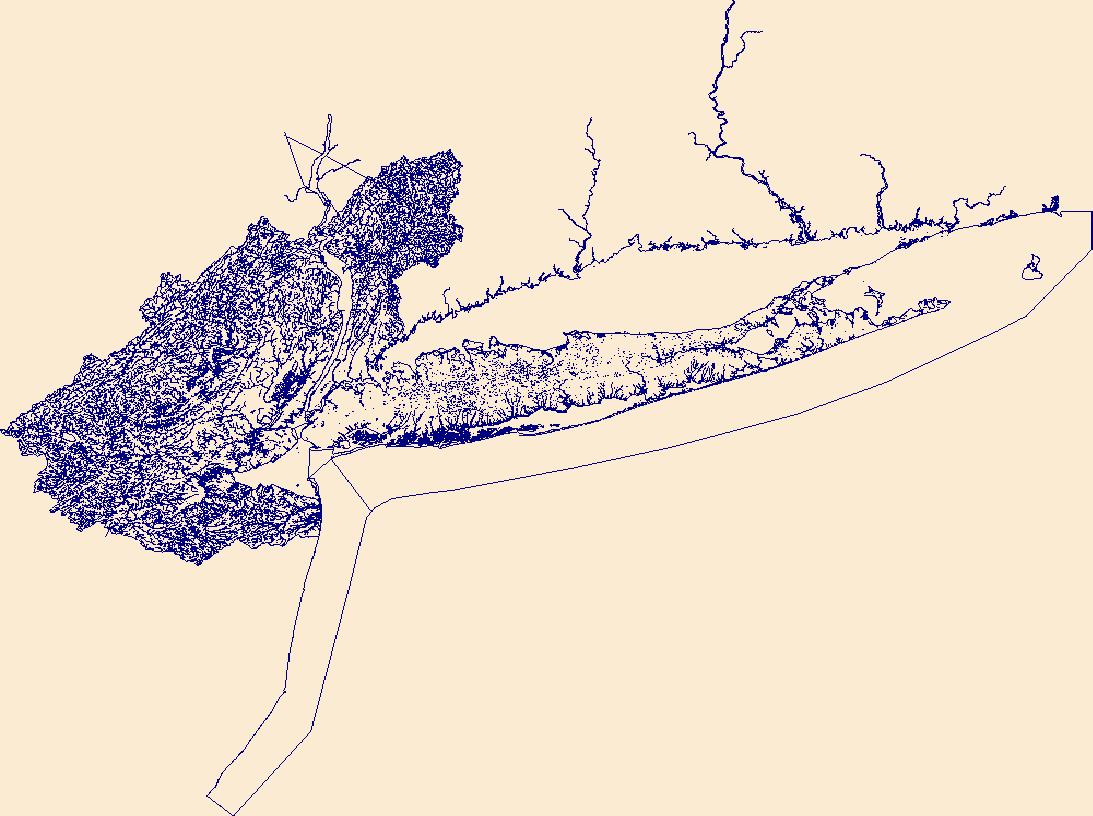
The High Resolution National Hydrography Dataset Plus (NHDPlus HR) is an integrated set of geospatial data layers, including the National Hydrography Dataset (NHD), National Watershed Boundary Dataset (WBD), and 3D Elevation Program Digital Elevation Model (3DEP DEM). The NHDPlus HR combines the NHD, 3DEP DEMs, and WBD to a data suite that includes the NHD stream network with linear referencing functionality, the WBD hydrologic units, elevation-derived catchment areas for each stream segment, "value added attributes" (VAAs), and other features that enhance hydrologic data analysis and routing.
Layered geospatial PDF 7.5 Minute Quadrangle Map. Layers of geospatial data include orthoimagery, roads, grids, geographic names, elevation contours, hydrography, and other selected map features. This map is derived from GIS (geospatial information system) data. It represents a repackaging of GIS data in traditional map form, not creation of new information. The geospatial data in this map are from selected National Map data holdings and other government sources.
The U.S. Geological Survey (USGS) is providing an online map of water level measurements in the Lloyd and North Shore aquifers on Long Island, New York, April-May 2013. USGS serves this map and geospatial data as a REST Open Map Service (as well as HTTP, JSON, KML, and shapefile), so end-users can use the map and data on mobile and web clients. A companion report, U.S. Geological Survey Scientific Investigations Map 3326 (Como and others, 2015; http://dx.doi.org/10.3133/sim3326) further describes data collection and map preparation and presents 68x22 in. PDF versions, 4 sheets, scale 1:125,000. This point shapefile consists of digital points that represent water level altitudes in the Lloyd and...
Categories: Data,
Publication;
Types: ArcGIS REST Map Service,
ArcGIS Service Definition,
Citation,
Downloadable,
Map Service;
Tags: Geospatial Applications,
Information Visualization,
Kings County,
Lloyd Aquifer,
Long Island,
Data and preliminary machine-learning models used to predict manganese and 1,4-dioxane in groundwater on Long Island are documented in this data release. Concentration data used to develop the models were from 910 wells for manganese and 553 wells for 1,4-dioxane, primarily public supply wells, from U.S. Geological Survey, U.S. Environmental Protection Agency (USEPA), and Suffolk County Water Authority sources. Thirty-two explanatory variables describe depth, groundwater flow, land use, soil properties, and other features of the aquifer system. The models use XGBoost, an ensemble tree machine learning method. Four models are documented for manganese, predicting the probability of concentrations relative to four...
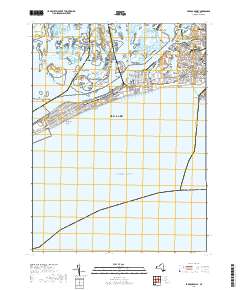
Layered geospatial PDF 7.5 Minute Quadrangle Map. Layers of geospatial data include orthoimagery, roads, grids, geographic names, elevation contours, hydrography, and other selected map features. This map is derived from GIS (geospatial information system) data. It represents a repackaging of GIS data in traditional map form, not creation of new information. The geospatial data in this map are from selected National Map data holdings and other government sources.
Layered geospatial PDF 7.5 Minute Quadrangle Map. Layers of geospatial data include orthoimagery, roads, grids, geographic names, elevation contours, hydrography, and other selected map features. This map is derived from GIS (geospatial information system) data. It represents a repackaging of GIS data in traditional map form, not creation of new information. The geospatial data in this map are from selected National Map data holdings and other government sources.
Layered geospatial PDF 7.5 Minute Quadrangle Map. Layers of geospatial data include orthoimagery, roads, grids, geographic names, elevation contours, hydrography, and other selected map features. This map is derived from GIS (geospatial information system) data. It represents a repackaging of GIS data in traditional map form, not creation of new information. The geospatial data in this map are from selected National Map data holdings and other government sources.
From March 2019 to September 2020, the U.S. Geological Survey, in cooperation with the New York City Department of Design and Construction and the New York State Department of Environmental Conservation, collected horizontal-to-vertical seismic (HVSR) surveys at 140 locations in New York, Bronx, Queens, Nassau, and Suffolk counties to estimate the thickness of unconsolidated sediments and the depth to bedrock (Lane and others, 2008). The passive-seismic method uses a single, broad-band three-component (two horizontal and one vertical) seismometer to record ambient seismic noise. In areas that have a strong acoustic contrast between the bedrock and overlying sediments, the seismic noise induces resonance at frequencies...
Categories: Data;
Types: Downloadable,
Map Service,
OGC WFS Layer,
OGC WMS Layer,
Shapefile;
Tags: Aquifer Mapping,
Basin & Hydrogeologic Characterization,
Bedrock,
Bronx County,
Nassau County,
This data release contains coastal wetland synthesis products for the geographic region of Hudson Valley and New York City, New York. Metrics for resiliency, including unvegetated to vegetated ratio (UVVR), marsh elevation, and mean tidal range, are calculated for smaller units delineated from a Digital Elevation Model, providing the spatial variability of physical factors that influence wetland health. Through scientific efforts initiated with the Hurricane Sandy Science Plan, the U.S. Geological Survey has been expanding national assessment of coastal change hazards and forecast products to coastal wetlands with the intent of providing Federal, State, and local managers with tools to estimate the vulnerability...
Categories: Data;
Types: Downloadable,
Map Service,
OGC WFS Layer,
OGC WMS Layer,
Shapefile;
Tags: Dutchess County,
Hudson River,
LTER,
Long-Term Ecological Research,
Lower Bay,
This data release contains coastal wetland synthesis products for the geographic region of Hudson Valley and New York City, New York. Metrics for resiliency, including unvegetated to vegetated ratio (UVVR), marsh elevation, and mean tidal range, are calculated for smaller units delineated from a Digital Elevation Model, providing the spatial variability of physical factors that influence wetland health. Through scientific efforts initiated with the Hurricane Sandy Science Plan, the U.S. Geological Survey has been expanding national assessment of coastal change hazards and forecast products to coastal wetlands with the intent of providing Federal, State, and local managers with tools to estimate the vulnerability...
The U.S. Geological Survey (USGS) is providing an online map of potentiometric-surface altitude contours in the Lloyd and North Shore aquifers on Long Island, New York, April-May 2013. USGS serves this map and geospatial data as a REST Open Map Service (as well as HTTP, JSON, KML, and shapefile), so end-users can use the map and data on mobile and web clients. A companion report, U.S. Geological Survey Scientific Investigations Map 3326 (Como and others, 2015; http://dx.doi.org/10.3133/sim3326) further describes data collection and map preparation and presents 68x22 in. PDF versions, 4 sheets, scale 1:125,000. This polyline shapefile consists of digital contours that represent the potentiometric-surface...
Categories: Data,
Publication;
Types: ArcGIS REST Map Service,
ArcGIS Service Definition,
Citation,
Downloadable,
Map Service;
Tags: Contours,
Contours,
Geospatial Applications,
Groundwater,
Groundwater,
The U.S. Geological Survey (USGS) is providing an online map of water-table altitude measurements in the upper glacial and Magothy aquifers on Long Island, New York, April-May 2013. USGS serves this map and geospatial data as a REST Open Map Service (as well as HTTP, JSON, KML, and shapefile), so end-users can use the map and data on mobile and web clients. A companion report, U.S. Geological Survey Scientific Investigations Map 3326 (Como and others, 2015; http://dx.doi.org/10.3133/sim3326) further describes data collection and map preparation and presents 68x22 in. PDF versions, 4 sheets, scale 1:125,000. Water level altitudes were measured at 334 observation wells and 1 supply well screened...
Categories: Data,
Publication;
Types: ArcGIS REST Map Service,
ArcGIS Service Definition,
Citation,
Downloadable,
Map Service;
Tags: Geospatial Applications,
Groundwater,
Hydrology,
Information Visualization,
Kings County,
Layered geospatial PDF 7.5 Minute Quadrangle Map. Layers of geospatial data include orthoimagery, roads, grids, geographic names, elevation contours, hydrography, and other selected map features. This map is derived from GIS (geospatial information system) data. It represents a repackaging of GIS data in traditional map form, not creation of new information. The geospatial data in this map are from selected National Map data holdings and other government sources.
|

|
