Filters: Tags: Rhode Island (X) > Types: Citation (X)
125 results (85ms)|
Filters
Date Range
Extensions
Types Contacts
Categories Tag Types
|
Layers of geospatial data include contours, boundaries, land cover, hydrography, roads, transportation, geographic names, structures, and other selected map features.
Types: Citation;
Tags: 7.5 x 7.5 minute,
7.5 x 7.5 minute,
Combined Vector,
Combined Vector,
Combined Vector,
Layers of geospatial data include contours, boundaries, land cover, hydrography, roads, transportation, geographic names, structures, and other selected map features.
Types: Citation;
Tags: 7.5 x 7.5 minute,
7.5 x 7.5 minute,
Combined Vector,
Combined Vector,
Combined Vector,

Layers of geospatial data include contours, boundaries, land cover, hydrography, roads, transportation, geographic names, structures, and other selected map features.
Types: Citation;
Tags: 7.5 x 7.5 minute,
7.5 x 7.5 minute,
Combined Vector,
Combined Vector,
Combined Vector,
Layers of geospatial data include contours, boundaries, land cover, hydrography, roads, transportation, geographic names, structures, and other selected map features.
Types: Citation;
Tags: 7.5 x 7.5 minute,
7.5 x 7.5 minute,
Combined Vector,
Combined Vector,
Combined Vector,
Layers of geospatial data include contours, boundaries, land cover, hydrography, roads, transportation, geographic names, structures, and other selected map features.
Types: Citation;
Tags: 7.5 x 7.5 minute,
7.5 x 7.5 minute,
BristolCounty,
BristolCounty,
Combined Vector,
The U. S. Geological Survey (USGS) makes long-term seismic hazard forecasts that are used in building codes. The hazard models usually consider only natural seismicity; non-tectonic (man-made) earthquakes are excluded because they are transitory or too small. In the past decade, however, thousands of earthquakes related to underground fluid injection have occurred in the central and eastern U.S. (CEUS), and some have caused damage. In response, the USGS is now also making short-term forecasts that account for the hazard from these induced earthquakes. A uniform earthquake catalog is assembled by combining and winnowing pre-existing source catalogs. Seismicity statistics are analyzed to develop recurrence models,...
Layers of geospatial data include contours, boundaries, land cover, hydrography, roads, transportation, geographic names, structures, and other selected map features.
Types: Citation;
Tags: 7.5 x 7.5 minute,
7.5 x 7.5 minute,
Combined Vector,
Combined Vector,
Combined Vector,
A series of 11 digital flood-inundation maps were developed for a 5.5 mile reach of the lower Pawcatuck River in Westerly, Rhode Island and Stonington and North Stonington, Connecticut by the U.S. Geological Survey in cooperation with the Town of Westerly, Rhode Island and the Rhode Island Office of Housing and Community Development. The coverage of the maps extends from downstream from the Ashaway River inflow at the Westerly, Rhode Island and North Stonington, Connecticut State border to about 500 feet (ft) downstream of the U.S. Route 1/Broad Street bridge on the state border between Westerly, Rhode Island and Stonington, Connecticut. A hydraulic model was used to compute water-surface profiles for 11 flood stages...
Types: Citation;
Tags: Connecticut,
New London County,
North Stonington,
Pawcatuck River,
Rhode Island,
This EnviroAtlas web service supports research and online mapping activities related to EnviroAtlas (https://www.epa.gov/enviroatlas). The Clean and Plentiful Water category in this web service includes layers illustrating the ecosystems and natural resources that filter and regulate water, the need or demand for clean and plentiful water, the impacts associated with water quality, and factors that place stress on water quality and supply. EnviroAtlas allows the user to interact with a web-based, easy-to-use, mapping application to view and analyze multiple ecosystem services for the conterminous United States. Additional descriptive information about each attribute in this web service is located within each web...
This EnviroAtlas web service supports research and online mapping activities related to EnviroAtlas (https://www.epa.gov/enviroatlas). The Food, Fuel, and Materials category in this web service includes layers illustrating the ecosystems and natural resources that provide or support the production of food, fuel, or other materials, the need or demand for these items, the impacts associated with their presence and accessibility, and factors that place stress on the natural environment's capability to provide these benefits. EnviroAtlas allows the user to interact with a web-based, easy-to-use, mapping application to view and analyze multiple ecosystem services for the conterminous United States. Additional descriptive...
WHISPers stands for Wildlife Health Information Sharing Partnership - event reporting system. It is a web-based repository for sharing basic information about historic and ongoing wildlife mortality (death) and morbidity (illness) events. The system possesses a searchable archive of wildlife mortality and morbidity event data that is available to the public. The information is opportunistically collected and does not reflect all the mortality events that occur in North America.
Layers of geospatial data include contours, boundaries, land cover, hydrography, roads, transportation, geographic names, structures, and other selected map features.
Types: Citation;
Tags: 7.5 x 7.5 minute,
7.5 x 7.5 minute,
Combined Vector,
Combined Vector,
Combined Vector,
This data set represents the results of calculations of hazard curves for a grid of points with a spacing of 0.05 degrees in latitude and longitude. It represents the chance of experiencing damaging earthquakes for fixed ground shaking levels that corresponds with MMI = VI. The values are obtained by averaging the probability of experiencing MMI = VI based on a peak ground acceleration value of 0.1155 g for site class D, and the probability of experiencing MMI = VI based on 1.0-second spectral acceleration value of 0.102 g for site class D. The data are for the Central and Eastern United States and are based on the one-year model.
Categories: Data;
Types: Citation,
Downloadable,
Map Service,
OGC WFS Layer,
OGC WMS Layer,
Shapefile;
Tags: Alabama,
Arizona,
Arkansas,
Colorado,
Connecticut,
This data set represents the hazard curves for a grid of points with a spacing of 0.05 degrees in latitude and longitude. It represents the annual rate of exceedance versus peak ground acceleration.
This data set provides industrial-scale onshore wind turbine locations, corresponding facility information, and turbine technical specifications, in the United States to March 2014. The database has nearly 49,000 wind turbine records that have been collected, digitized, locationally verified, and internally quality assured and quality controlled. Turbines from the Federal Aviation Administration Digital Obstacle File, product date March 2, 2014, were used as the primary source of turbine data points. Verification of the position of turbines was done by visual interpretation using high-resolution aerial imagery in ESRI ArcGIS Desktop. Turbines without Federal Aviation Administration Obstacle Repository System (FAA...
Categories: Data;
Types: ArcGIS REST Map Service,
Citation,
Map Service;
Tags: Alabama,
Alaska,
Arizona,
Arkansas,
California,
Layers of geospatial data include contours, boundaries, land cover, hydrography, roads, transportation, geographic names, structures, and other selected map features.
Types: Citation;
Tags: 7.5 x 7.5 minute,
7.5 x 7.5 minute,
Combined Vector,
Combined Vector,
Combined Vector,
Atlantic coast piping plover (Charadrius melodus) nest sites are typically found on low-lying beach and dune systems, which respond rapidly to coastal processes like sediment overwash, inlet formation, and island migration that are sensitive to climate-related changes in storminess and the rate of sea-level rise. Data were obtained to understand piping plover habitat distribution and use along their Atlantic Coast breeding range. A smartphone application called iPlover was developed to collect standardized data on habitat characteristics at piping plover nest locations. The application capitalized on a network of trained monitors that observe piping plovers throughout their U.S. Atlantic coast breeding range as...
USGS National Boundary Dataset (NBD) in Rhode Island State or Territory (published 20240215) FileGDB
Geospatial data is comprised of government boundaries.
Types: Citation;
Tags: Boundaries,
Bristol,
County or Equivalent,
Downloadable Data,
Esri File GeoDatabase 10,
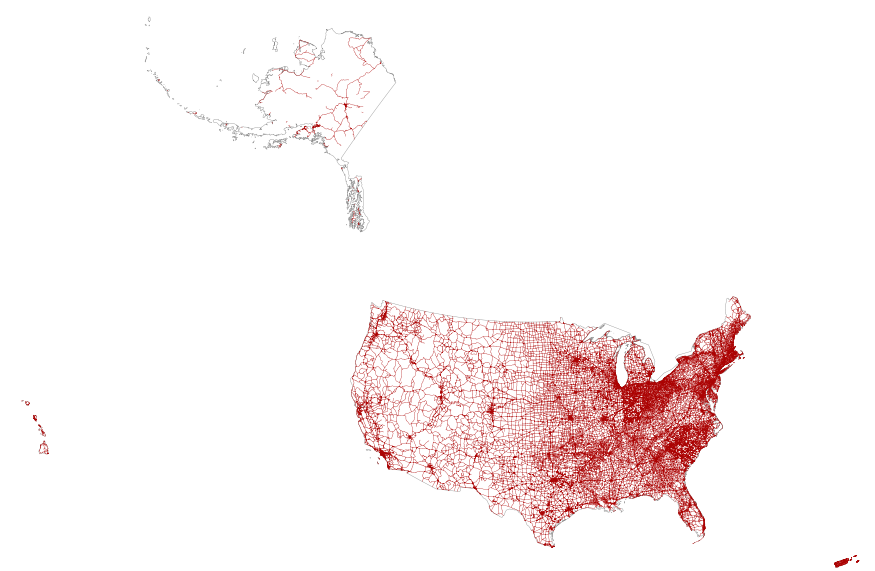
This map layer portrays the major roads in the United States, Puerto Rico, and the U.S. Virgin Islands. The file was produced by joining the individual State roads layers from the National Highway Planning Network (NHPN), Geographic Data Technology (GDT) Dynamap, and TIGER/Line files. This is a revised version of the July 2012 map layer.
This data set represents the results of calculations of hazard curves for a grid of points with a spacing of 0.05 degrees in latitude and longitude. This particular data set is for horizontal spectral response acceleration for 1.0-second period with a 1 percent probability of exceedance in 1 year. The data are for the Central and Eastern United States and are based on the one-year model.
Categories: Data;
Types: Citation,
Downloadable,
Map Service,
OGC WFS Layer,
OGC WMS Layer,
Shapefile;
Tags: Alabama,
Arizona,
Arkansas,
Colorado,
Connecticut,
|

|
