Filters: Tags: Rockland County (X)
22 results (45ms)|
Filters
Date Range
Extensions (Less) Types (Less)
Contacts (Less)
Categories (Less) Tag Types
|
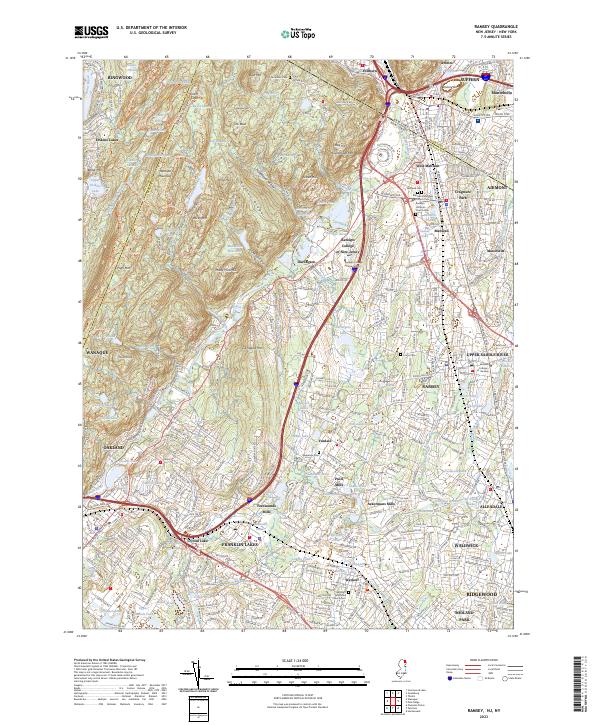
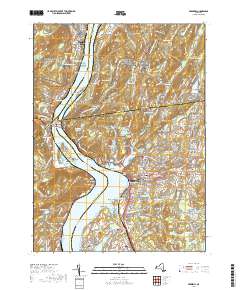
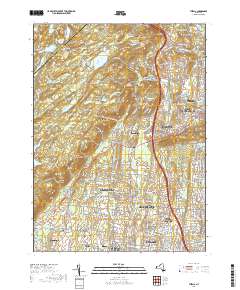
Layered geospatial PDF 7.5 Minute Quadrangle Map. Layers of geospatial data include orthoimagery, roads, grids, geographic names, elevation contours, hydrography, and other selected map features. This map is derived from GIS (geospatial information system) data. It represents a repackaging of GIS data in traditional map form, not creation of new information. The geospatial data in this map are from selected National Map data holdings and other government sources.
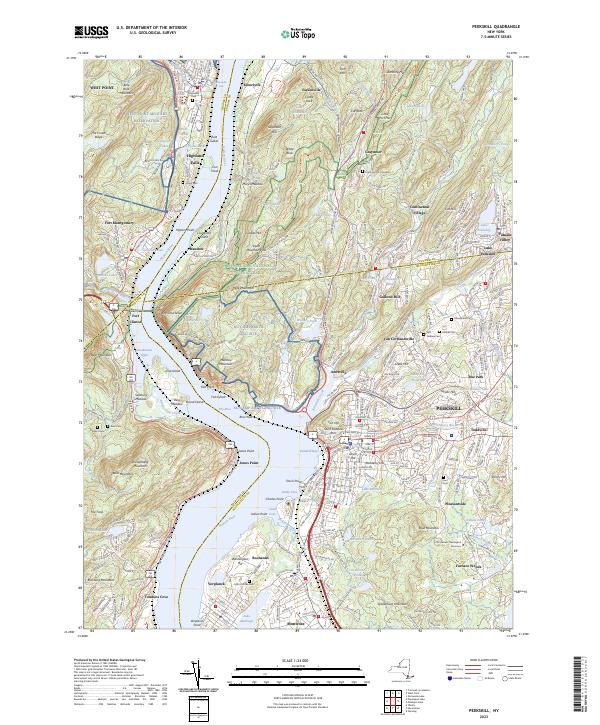
Layered geospatial PDF 7.5 Minute Quadrangle Map. Layers of geospatial data include orthoimagery, roads, grids, geographic names, elevation contours, hydrography, and other selected map features. This map is derived from GIS (geospatial information system) data. It represents a repackaging of GIS data in traditional map form, not creation of new information. The geospatial data in this map are from selected National Map data holdings and other government sources.
From July through November 2018, 48 environmental samples and four quality-control samples were collected throughout the Lower Hudson, Chemung, and Eastern Lake Ontario River Basins. Samples were collected from seven production wells and eight domestic wells in the Eastern Lake Ontario Basin, 13 production wells and 12 domestic wells in the Lower Hudson River Basin, and four production wells and four domestic wells in the Chemung River Basin. Of the wells sampled, 27 were completed in bedrock and 21 were completed in sand and gravel. Approximately 20 percent of samples were collected from wells that were previously sampled in 2003, 2008, and 2013. Groundwater samples were collected prior to any treatment or filtration...
Categories: Data;
Types: Map Service,
OGC WFS Layer,
OGC WMS Layer,
OGC WMS Service;
Tags: Albany County,
Allegany County,
Ambient Monitoring,
Chemung County,
Chemung River Basin,
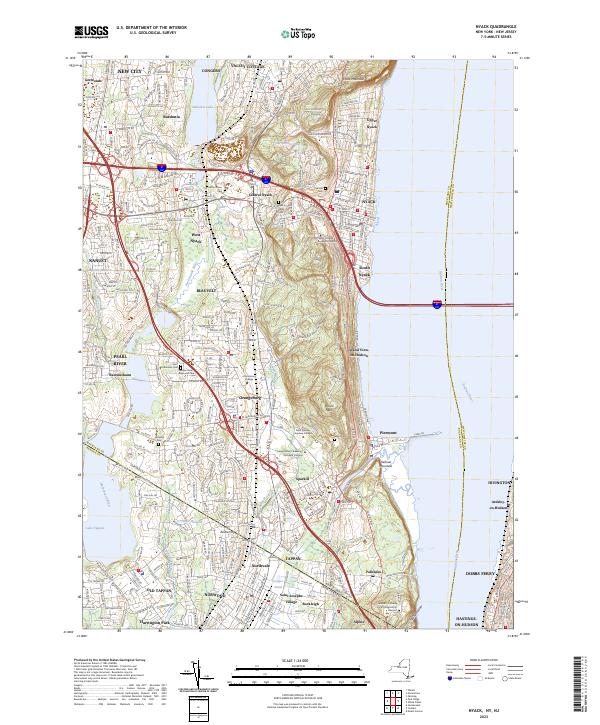
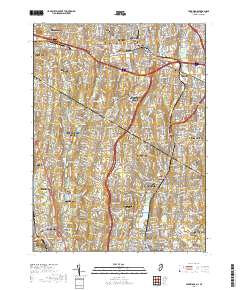
Layered geospatial PDF 7.5 Minute Quadrangle Map. Layers of geospatial data include orthoimagery, roads, grids, geographic names, elevation contours, hydrography, and other selected map features. This map is derived from GIS (geospatial information system) data. It represents a repackaging of GIS data in traditional map form, not creation of new information. The geospatial data in this map are from selected National Map data holdings and other government sources.
Layered geospatial PDF 7.5 Minute Quadrangle Map. Layers of geospatial data include orthoimagery, roads, grids, geographic names, elevation contours, hydrography, and other selected map features. This map is derived from GIS (geospatial information system) data. It represents a repackaging of GIS data in traditional map form, not creation of new information. The geospatial data in this map are from selected National Map data holdings and other government sources.
Layered geospatial PDF 7.5 Minute Quadrangle Map. Layers of geospatial data include orthoimagery, roads, grids, geographic names, elevation contours, hydrography, and other selected map features. This map is derived from GIS (geospatial information system) data. It represents a repackaging of GIS data in traditional map form, not creation of new information. The geospatial data in this map are from selected National Map data holdings and other government sources.
Layered geospatial PDF 7.5 Minute Quadrangle Map. Layers of geospatial data include orthoimagery, roads, grids, geographic names, elevation contours, hydrography, and other selected map features. This map is derived from GIS (geospatial information system) data. It represents a repackaging of GIS data in traditional map form, not creation of new information. The geospatial data in this map are from selected National Map data holdings and other government sources.
INTRODUCTION • Concerns over the viability of the fractured bedrock aquifer that provides about 1/3 of Rockland County’s water supply prompted a 5-year study by the U.S. Geological Survey (USGS) to (1) define the hydrogeologic framework of the aquifer, (2) assess conditions within it, and (3) identify other potential sources of water for the County. The study was done in cooperation with Rockland County and the New York State Department of Environmental Conservation. • Population growth in Rockland County to nearly 300,000 people has been paralleled by significant hydrologic changes over the past 50 years –water demand and impervious surface area have increased, and sanitary sewers now serve most areas and discharge...
Categories: Data,
Project;
Types: Downloadable,
Map Service,
OGC WFS Layer,
OGC WMS Layer,
Shapefile;
Tags: Completed,
Cooperative Water Program,
GW or SW,
GW or SW,
GW or SW,
Layered geospatial PDF 7.5 Minute Quadrangle Map. Layers of geospatial data include orthoimagery, roads, grids, geographic names, elevation contours, hydrography, and other selected map features. This map is derived from GIS (geospatial information system) data. It represents a repackaging of GIS data in traditional map form, not creation of new information. The geospatial data in this map are from selected National Map data holdings and other government sources.
Layered geospatial PDF 7.5 Minute Quadrangle Map. Layers of geospatial data include orthoimagery, roads, grids, geographic names, elevation contours, hydrography, and other selected map features. This map is derived from GIS (geospatial information system) data. It represents a repackaging of GIS data in traditional map form, not creation of new information. The geospatial data in this map are from selected National Map data holdings and other government sources.
Layered geospatial PDF 7.5 Minute Quadrangle Map. Layers of geospatial data include orthoimagery, roads, grids, geographic names, elevation contours, hydrography, and other selected map features. This map is derived from GIS (geospatial information system) data. It represents a repackaging of GIS data in traditional map form, not creation of new information. The geospatial data in this map are from selected National Map data holdings and other government sources.
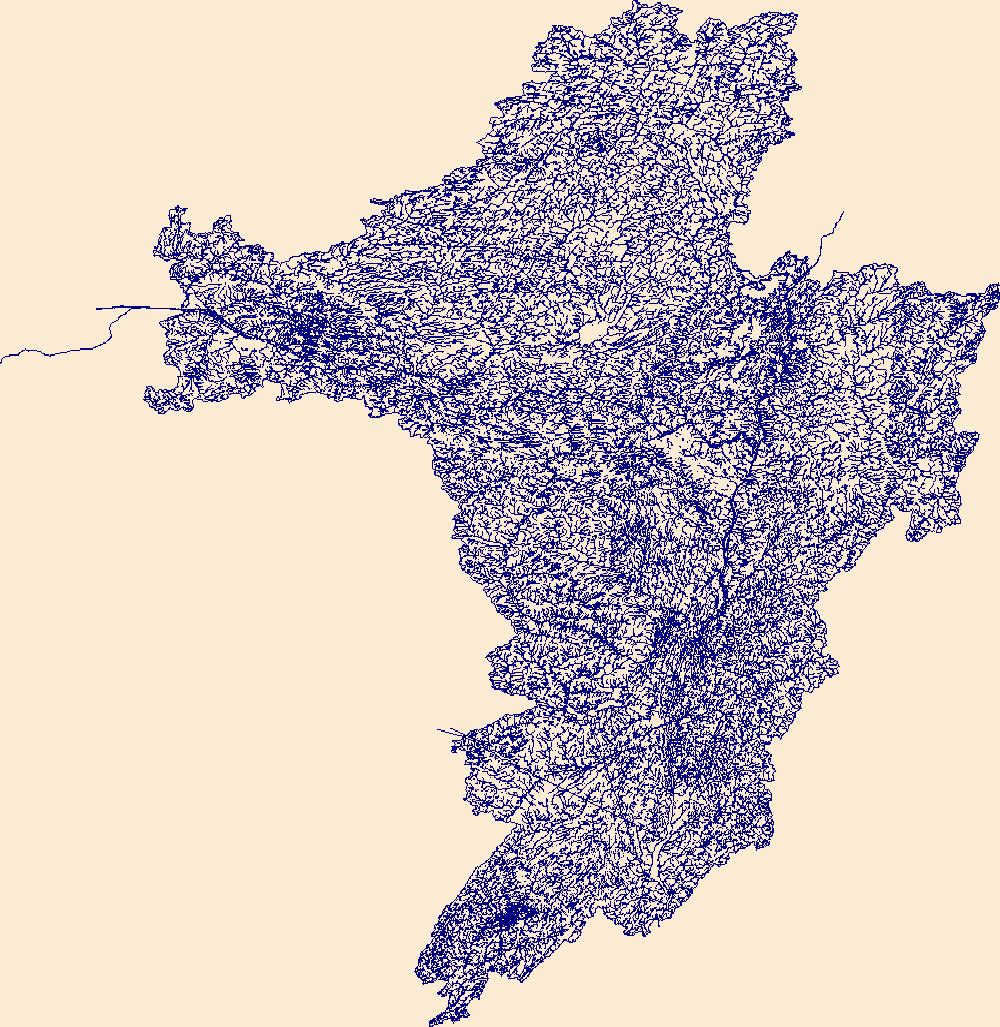
The High Resolution National Hydrography Dataset Plus (NHDPlus HR) is an integrated set of geospatial data layers, including the National Hydrography Dataset (NHD), National Watershed Boundary Dataset (WBD), and 3D Elevation Program Digital Elevation Model (3DEP DEM). The NHDPlus HR combines the NHD, 3DEP DEMs, and WBD to a data suite that includes the NHD stream network with linear referencing functionality, the WBD hydrologic units, elevation-derived catchment areas for each stream segment, "value added attributes" (VAAs), and other features that enhance hydrologic data analysis and routing.
Layered geospatial PDF 7.5 Minute Quadrangle Map. Layers of geospatial data include orthoimagery, roads, grids, geographic names, elevation contours, hydrography, and other selected map features. This map is derived from GIS (geospatial information system) data. It represents a repackaging of GIS data in traditional map form, not creation of new information. The geospatial data in this map are from selected National Map data holdings and other government sources.
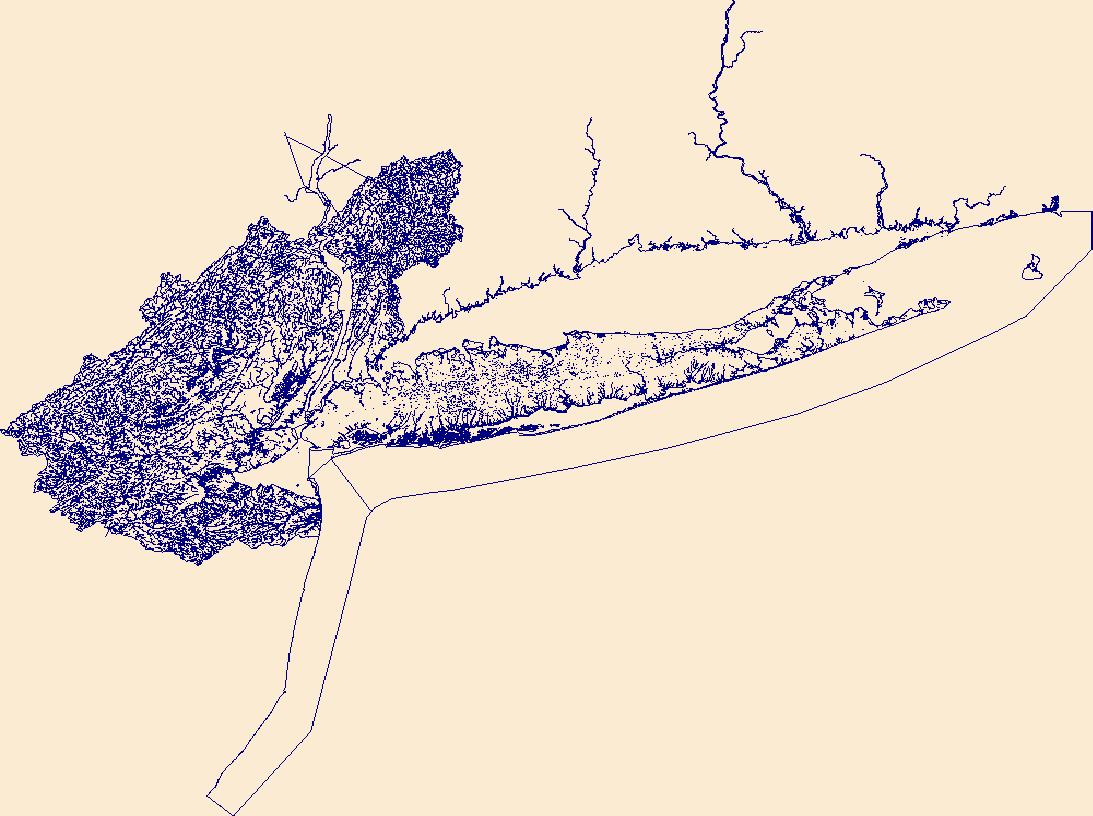
The High Resolution National Hydrography Dataset Plus (NHDPlus HR) is an integrated set of geospatial data layers, including the National Hydrography Dataset (NHD), National Watershed Boundary Dataset (WBD), and 3D Elevation Program Digital Elevation Model (3DEP DEM). The NHDPlus HR combines the NHD, 3DEP DEMs, and WBD to a data suite that includes the NHD stream network with linear referencing functionality, the WBD hydrologic units, elevation-derived catchment areas for each stream segment, "value added attributes" (VAAs), and other features that enhance hydrologic data analysis and routing.

Layered geospatial PDF 7.5 Minute Quadrangle Map. Layers of geospatial data include orthoimagery, roads, grids, geographic names, elevation contours, hydrography, and other selected map features. This map is derived from GIS (geospatial information system) data. It represents a repackaging of GIS data in traditional map form, not creation of new information. The geospatial data in this map are from selected National Map data holdings and other government sources.
Layered geospatial PDF 7.5 Minute Quadrangle Map. Layers of geospatial data include orthoimagery, roads, grids, geographic names, elevation contours, hydrography, and other selected map features. This map is derived from GIS (geospatial information system) data. It represents a repackaging of GIS data in traditional map form, not creation of new information. The geospatial data in this map are from selected National Map data holdings and other government sources.
Layered geospatial PDF 7.5 Minute Quadrangle Map. Layers of geospatial data include orthoimagery, roads, grids, geographic names, elevation contours, hydrography, and other selected map features. This map is derived from GIS (geospatial information system) data. It represents a repackaging of GIS data in traditional map form, not creation of new information. The geospatial data in this map are from selected National Map data holdings and other government sources.
Layered geospatial PDF 7.5 Minute Quadrangle Map. Layers of geospatial data include orthoimagery, roads, grids, geographic names, elevation contours, hydrography, and other selected map features. This map is derived from GIS (geospatial information system) data. It represents a repackaging of GIS data in traditional map form, not creation of new information. The geospatial data in this map are from selected National Map data holdings and other government sources.
Layered geospatial PDF 7.5 Minute Quadrangle Map. Layers of geospatial data include orthoimagery, roads, grids, geographic names, elevation contours, hydrography, and other selected map features. This map is derived from GIS (geospatial information system) data. It represents a repackaging of GIS data in traditional map form, not creation of new information. The geospatial data in this map are from selected National Map data holdings and other government sources.
Layered geospatial PDF 7.5 Minute Quadrangle Map. Layers of geospatial data include orthoimagery, roads, grids, geographic names, elevation contours, hydrography, and other selected map features. This map is derived from GIS (geospatial information system) data. It represents a repackaging of GIS data in traditional map form, not creation of new information. The geospatial data in this map are from selected National Map data holdings and other government sources.
|

|
