Filters: Tags: San Juan County (X)
857 results (53ms)|
Filters
Date Range
Extensions Types Contacts
Categories Tag Types
|
Layered geospatial PDF 7.5 Minute Quadrangle Map. Layers of geospatial data include orthoimagery, roads, grids, geographic names, elevation contours, hydrography, and other selected map features. This map is derived from GIS (geospatial information system) data. It represents a repackaging of GIS data in traditional map form, not creation of new information. The geospatial data in this map are from selected National Map data holdings and other government sources.
This dataset includes magnetotelluric (MT) sounding data collected in July 2019 in the Silverton Caldera complex, Colorado, in the Southern Rocky Mountain Volcanic Field, by the U.S. Geological Survey (USGS). Along with geologic mapping, airborne magnetics, airborne electromagnetics, and audiomagnetotellurics, the USGS collected MT data at 24 sites along five profiles ranging from 2 to 5 kilometers in length: across Red Mountain of the Silverton caldera, within the caldera in Eureka Graben, across the south-eastern margin of the caldera along Arrastra Gulch, across the southern margin of the caldera along the western margin of Kendall Mountain, and across the south-western margin of the caldera along South Fork...
Audiomagnetotelluric sounding data in the Silverton Caldera complex, Colorado, 2019; Station AMTAG03
This dataset includes audiomagnetotelluric (AMT) sounding data collected in July 2019 in the Silverton Caldera complex, Colorado, in the Southern Rocky Mountain Volcanic Field, by the U.S. Geological Survey (USGS). Along with geologic mapping, airborne magnetics, airborne electromagnetics, and magnetotellurics, the USGS collected AMT data at 26 sites along five profiles ranging from 2 to 5 kilometers in length: across Red Mountain of the Silverton caldera, within the caldera in Eureka Graben, across the south-eastern margin of the caldera along Arrastra Gulch, across the southern margin of the caldera along the western margin of Kendall Mountain, and across the south-western margin of the caldera along South Fork...
Two models of fire risk are presented here. One shows risk of natural fire based on abundance of tamarisk and native trees only. The other shows risk of all fire, which includes abundance of tamarisk and native trees, but also proximity of human ignition sources (roads and campgrounds). Associated layers of the river channel at low flow and bottomland boundaries are included for reference.
Categories: Data;
Types: ArcGIS REST Map Service,
ArcGIS Service Definition,
Downloadable,
Map Service;
Tags: Canyonlands National Park,
Colorado River,
Grand County,
Risk of all fire,
San Juan County,
This dataset represents the prevalence of trees as mapped along the Colorado River bottomland from the Colorado state line (San Juan and Grand Counties, Utah) to the southern Canyonlands NP boundary, as of September 2010. This mapping was conducted as part of the Colorado River Conservation Planning Project, a joint effort between the National Park Service, The Nature Conservancy, US Geological Survey, Bureau of Land Management, and Utah Forestry Fire and State Lands.
Categories: Data;
Types: Citation,
Downloadable,
Map Service,
OGC WFS Layer,
OGC WMS Layer,
Shapefile;
Tags: Arches National Park,
Canyonlands National Park,
Colorado River,
Grand County,
Moab,
This map shows stillness of water near bank vegetation within 15 m of the channel boundary (2011) of the Colorado River mainstem between the Utah Colorado border and the upper pool of Lake Powell, Utah (146 miles). The channel boundary was mapped from public available NAIP imagery flown on June 28, 2011, when the river flow was 886 m3/s at the Cisco gage. The channel is subdivided into channel types: main channel, secondary channel, backwater, isolated pool and tributary channel.
Categories: Data;
Types: Citation,
Downloadable,
Map Service,
OGC WFS Layer,
OGC WMS Layer,
Shapefile;
Tags: Arches National Park,
Canyonlands National Park,
Colorado River,
Grand County,
Moab,
Layers of geospatial data include contours, boundaries, land cover, hydrography, roads, transportation, geographic names, structures, and other selected map features.
Types: Citation;
Tags: 7.5 x 7.5 minute,
7.5 x 7.5 minute,
Canóvanas County,
Carolina County,
Combined Vector,
Layered geospatial PDF 7.5 Minute Quadrangle Map. Layers of geospatial data include orthoimagery, roads, grids, geographic names, elevation contours, hydrography, and other selected map features. This map is derived from GIS (geospatial information system) data. It represents a repackaging of GIS data in traditional map form, not creation of new information. The geospatial data in this map are from selected National Map data holdings and other government sources.
This data release includes magnetotelluric (MT) sounding data collected in July 2018 in the Silverton Caldera complex, Colorado, in the Southern Rocky Mountain Volcanic Field, by the U.S. Geological Survey (USGS). Along with geologic mapping, airborne magnetics, airborne electromagnetics, and audiomagnetotellurics, the USGS collected MT data at 22 sites along four profiles ranging from 3 to 6 kilometers in length across the north-western structural margin of the Silverton caldera in Mineral Basin (MB01-MB05), across the south-eastern margin of the caldera along Cunningham Creek (CC01-CC05), within the caldera in Eureka Graben (EG01-EG05), and within the caldera along upper Cement Creek near the Gold King mine (GK01-GK09).
This data release includes magnetotelluric (MT) sounding data collected in July 2018 in the Silverton Caldera complex, Colorado, in the Southern Rocky Mountain Volcanic Field, by the U.S. Geological Survey (USGS). Along with geologic mapping, airborne magnetics, airborne electromagnetics, and audiomagnetotellurics, the USGS collected MT data at 22 sites along four profiles ranging from 3 to 6 kilometers in length across the north-western structural margin of the Silverton caldera in Mineral Basin (MB01-MB05), across the south-eastern margin of the caldera along Cunningham Creek (CC01-CC05), within the caldera in Eureka Graben (EG01-EG05), and within the caldera along upper Cement Creek near the Gold King mine (GK01-GK09).
This data release includes magnetotelluric (MT) sounding data collected in July 2018 in the Silverton Caldera complex, Colorado, in the Southern Rocky Mountain Volcanic Field, by the U.S. Geological Survey (USGS). Along with geologic mapping, airborne magnetics, airborne electromagnetics, and audiomagnetotellurics, the USGS collected MT data at 22 sites along four profiles ranging from 3 to 6 kilometers in length across the north-western structural margin of the Silverton caldera in Mineral Basin (MB01-MB05), across the south-eastern margin of the caldera along Cunningham Creek (CC01-CC05), within the caldera in Eureka Graben (EG01-EG05), and within the caldera along upper Cement Creek near the Gold King mine (GK01-GK09).
Layers of geospatial data include contours, boundaries, land cover, hydrography, roads, transportation, geographic names, structures, and other selected map features.
Layers of geospatial data include contours, boundaries, land cover, hydrography, roads, transportation, geographic names, structures, and other selected map features.
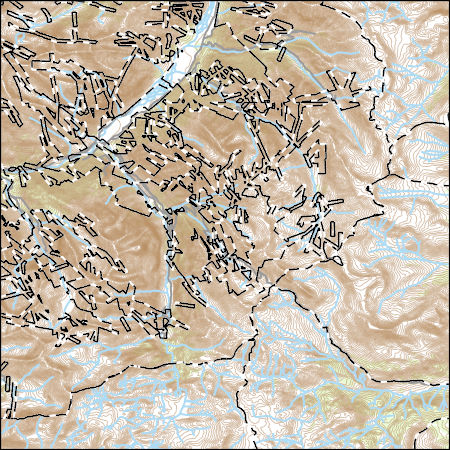
USGS Topo Map Vector Data (Vector) 44501 Telluride, Colorado 20220512 for 7.5 x 7.5 minute Shapefile
Layers of geospatial data include contours, boundaries, land cover, hydrography, roads, transportation, geographic names, structures, and other selected map features.
Layers of geospatial data include contours, boundaries, land cover, hydrography, roads, transportation, geographic names, structures, and other selected map features.
Situated in a remote corner of northwestern New Mexico, Chaco Culture National Historical Park (CCNHP) was once the center of a sophisticated social, political and architectural civilization with a 50,000-square mile sphere of influence. The park protects the greatest concentration of Chacoan historical sites in the American Southwest and is arguably the most significant prehistoric site in North America. Following decades of unsuccessful attempts to develop usable near-surface water sources, the National Park Service constructed a 3,100-foot deep well into the Gallup Sandstone aquifer in 1972, providing the park with the first reliable drinking water source since it was established in 1907. The ~100-foot thick...
In support of U.S. Geological Survey (USGS) Southwest Biological Science Center researchers, and in coordination with the Bureau of Land Management (BLM) and National Ecological Observatory Network (NEON), the USGS National Uncrewed Systems Office (NUSO) conducted uncrewed aircraft systems (UAS) remote sensing flights over two BLM Assessment, Inventory, and Monitoring (AIM) plots at the NEON Moab site in Utah for multi-scale carbon sequestration research on public lands.The UAS data collected include natural color, multispectral, and hyperspectral imagery, and lidar to capture diverse information about vegetation and soils on two dryland sites approximately 40 km south of Moab, Utah. The first site (“site 1”) features...
Categories: Data;
Types: Map Service,
OGC WFS Layer,
OGC WMS Layer,
OGC WMS Service;
Tags: Remote Sensing,
San Juan County,
UAS,
USGS Science Data Catalog (SDC),
Utah,

The High Resolution National Hydrography Dataset Plus (NHDPlus HR) is an integrated set of geospatial data layers, including the National Hydrography Dataset (NHD), National Watershed Boundary Dataset (WBD), and 3D Elevation Program Digital Elevation Model (3DEP DEM). The NHDPlus HR combines the NHD, 3DEP DEMs, and WBD to a data suite that includes the NHD stream network with linear referencing functionality, the WBD hydrologic units, elevation-derived catchment areas for each stream segment, "value added attributes" (VAAs), and other features that enhance hydrologic data analysis and routing.
Layered geospatial PDF 7.5 Minute Quadrangle Map. Layers of geospatial data include orthoimagery, roads, grids, geographic names, elevation contours, hydrography, and other selected map features. This map is derived from GIS (geospatial information system) data. It represents a repackaging of GIS data in traditional map form, not creation of new information. The geospatial data in this map are from selected National Map data holdings and other government sources.
Layered geospatial PDF 7.5 Minute Quadrangle Map. Layers of geospatial data include orthoimagery, roads, grids, geographic names, elevation contours, hydrography, and other selected map features. This map is derived from GIS (geospatial information system) data. It represents a repackaging of GIS data in traditional map form, not creation of new information. The geospatial data in this map are from selected National Map data holdings and other government sources.
|

|
