Filters: Tags: San Mateo County (X)
183 results (73ms)|
Filters
Date Range
Extensions Types Contacts
Categories Tag Types Tag Schemes |
This part of DS 781 presents data for the sediment-thickness isopachs for the Pigeon Point to Monterey Bay, California, map region. The vector data file is included in "Isopachs_PigeonPointToMonterey.zip," which is accessible from https://doi.org/10.5066/F7N29V0Z. As part of the USGS's California State Waters Mapping Project, a 50-m-resolution grid of sediment thickness for the seafloor within the limit of California’s State Waters between Pigeon Point and southern Monterey Bay was generated from seismic-reflection data collected in 2009, 2010, and 2011 (USGS activities (S-15-10-NC, S-N1-09-MB, and S-06-11-MB) supplemented with outcrop and geologic structure from DS 781. Isopach contours at 2.5-meter intervals were...
Categories: Data;
Types: Downloadable,
Map Service,
OGC WFS Layer,
OGC WMS Layer,
Shapefile;
Tags: Ano Nuevo,
Aptos,
Distributions,
Marina,
Monterey,
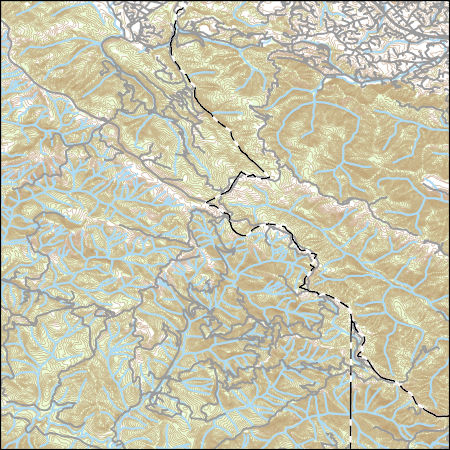
Layered geospatial PDF 7.5 Minute Quadrangle Map. Layers of geospatial data include orthoimagery, roads, grids, geographic names, elevation contours, hydrography, and other selected map features. This map is derived from GIS (geospatial information system) data. It represents a repackaging of GIS data in traditional map form, not creation of new information. The geospatial data in this map are from selected National Map data holdings and other government sources.
Layered geospatial PDF 7.5 Minute Quadrangle Map. Layers of geospatial data include orthoimagery, roads, grids, geographic names, elevation contours, hydrography, and other selected map features. This map is derived from GIS (geospatial information system) data. It represents a repackaging of GIS data in traditional map form, not creation of new information. The geospatial data in this map are from selected National Map data holdings and other government sources.
Layered geospatial PDF 7.5 Minute Quadrangle Map. Layers of geospatial data include orthoimagery, roads, grids, geographic names, elevation contours, hydrography, and other selected map features. This map is derived from GIS (geospatial information system) data. It represents a repackaging of GIS data in traditional map form, not creation of new information. The geospatial data in this map are from selected National Map data holdings and other government sources.
These vector contour lines are derived from the 3D Elevation Program using automated and semi-automated processes. They were created to support 1:24,000-scale CONUS and Hawaii, 1:25,000-scale Alaska, and 1:20,000-scale Puerto Rico / US Virgin Island topographic map products, but are also published in this GIS vector format. Contour intervals are assigned by 7.5-minute quadrangle, so this vector dataset is not visually seamless across quadrangle boundaries. The vector lines have elevation attributes (in feet above mean sea level on NAVD88), but this dataset does not carry line symbols or annotation.
Layers of geospatial data include contours, boundaries, land cover, hydrography, roads, transportation, geographic names, structures, and other selected map features.
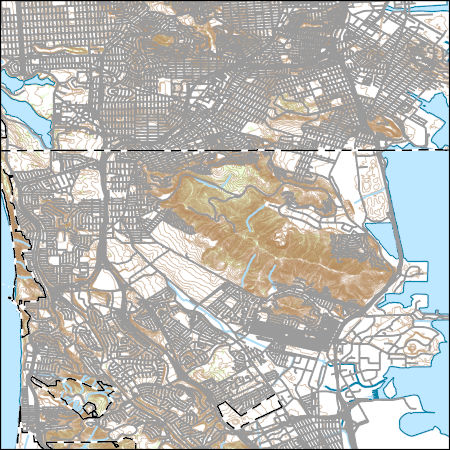
Layers of geospatial data include contours, boundaries, land cover, hydrography, roads, transportation, geographic names, structures, and other selected map features.
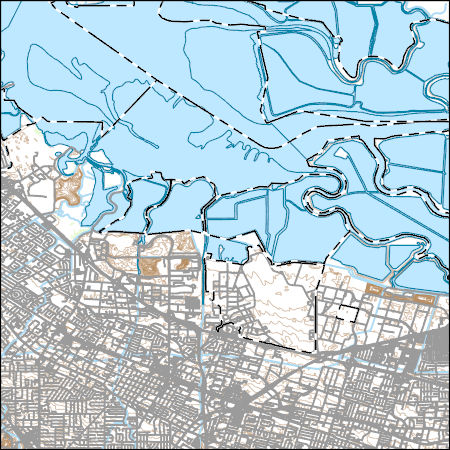
Layers of geospatial data include contours, boundaries, land cover, hydrography, roads, transportation, geographic names, structures, and other selected map features.
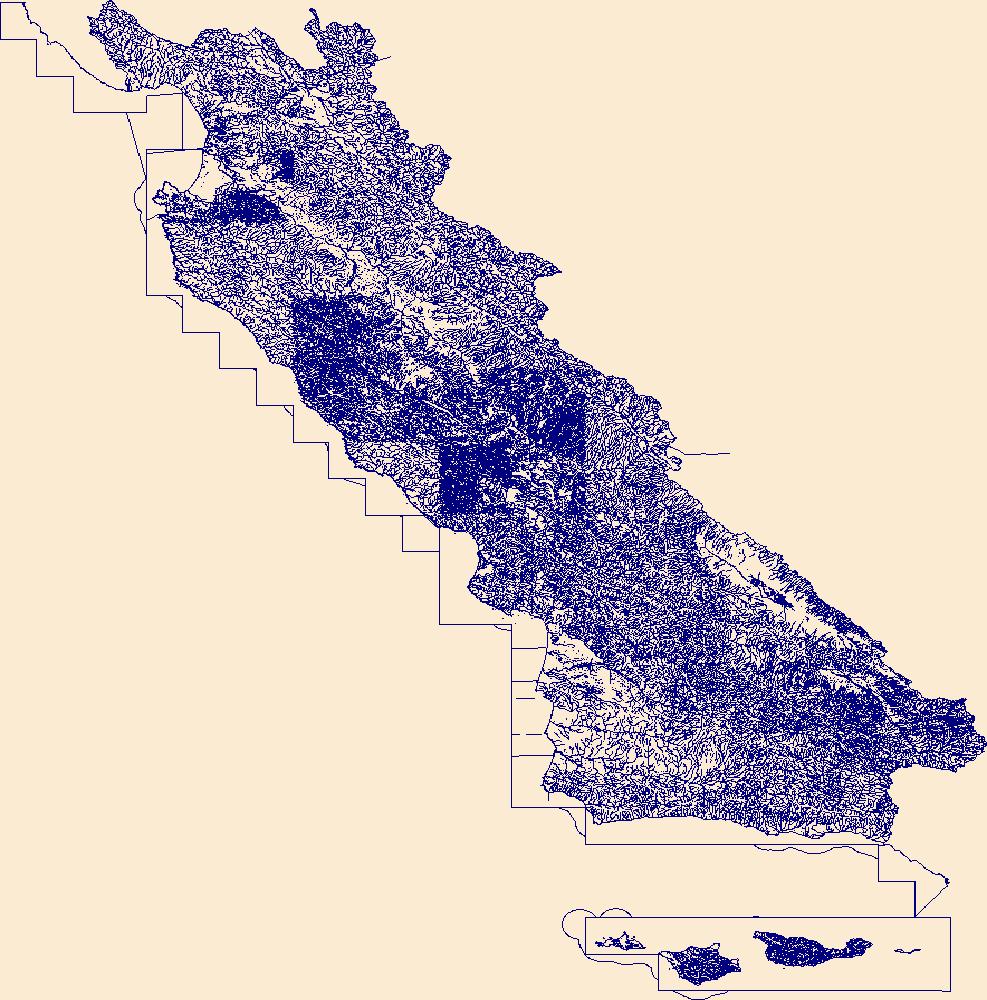
The High Resolution National Hydrography Dataset Plus (NHDPlus HR) is an integrated set of geospatial data layers, including the best available National Hydrography Dataset (NHD), the 10-meter 3D Elevation Program Digital Elevation Model (3DEP DEM), and the National Watershed Boundary Dataset (WBD). The NHDPlus HR combines the NHD, 3DEP DEMs, and WBD to create a stream network with linear referencing, feature naming, "value added attributes" (VAAs), elevation-derived catchments, and other features for hydrologic data analysis. The stream network with linear referencing is a system of data relationships applied to hydrographic systems so that one stream reach "flows" into another and "events" can be tied to and traced...
A study comparing reintroduction scenarios for the San Francisco gartersnake (Thamnophis sirtalis tetrataenia), an endangered subspecies native to San Mateo County and Santa Cruz County in northern California. Models for snake survival, growth, fecundity, and reproductive status were used to construct a demographic population model. Data are posterior distributions for demographic parameters from Markov Chain Monte Carlo sampling in hierarchical Bayesian models. These data support the following publication: Rose, J.P., Kim, R., Schoening, E.J., Lien, P.C., and Halstead, B.J., 2023. Comparing reintroduction strategies for the endangered San Francisco gartersnake (Thamnophis sirtalis tetrataenia) using demographic...
Categories: Data;
Tags: California,
San Mateo County,
USGS Science Data Catalog (SDC),
Wildlife Biology,
biota,
This data contains maximum model-derived significant wave height (in meters) for the sea-level rise (SLR) and storm condition indicated. The Coastal Storm Modeling System (CoSMoS) makes detailed predictions (meter-scale) over large geographic scales (100s of kilometers) of storm-induced coastal flooding and erosion for both current and future sea-level rise (SLR) scenarios. Projections for CoSMoS v3.1 in Central California include flood-hazard information for the coast from Pt. Conception to the Golden Gate bridge. Outputs include SLR scenarios of 0.0, 0.25, 0.5, 0.75, 1.0, 1.5, 2.0, 2.5, 3.0, and 5.0 meters; storm scenarios include background conditions (astronomic spring tide and average atmospheric conditions)...
Categories: Data;
Types: Map Service,
OGC WFS Layer,
OGC WMS Layer,
OGC WMS Service;
Tags: Beaches,
CMHRP,
Central California,
Central California Coast,
Climate change,
This data contains maximum model-derived ocean currents (in meters per second) for the sea-level rise (SLR) and storm condition indicated. The Coastal Storm Modeling System (CoSMoS) makes detailed predictions (meter-scale) over large geographic scales (100s of kilometers) of storm-induced coastal flooding and erosion for both current and future sea-level rise (SLR) scenarios. Projections for CoSMoS v3.1 in Central California include flood-hazard information for the coast from Pt. Conception to the Golden Gate bridge. Outputs include SLR scenarios of 0.0, 0.25, 0.5, 0.75, 1.0, 1.5, 2.0, 2.5, 3.0, and 5.0 meters; storm scenarios include background conditions (astronomic spring tide and average atmospheric conditions)...
Categories: Data;
Types: Map Service,
OGC WFS Layer,
OGC WMS Layer,
OGC WMS Service;
Tags: Beaches,
CMHRP,
Central California,
Central California Coast,
Climate change,
This data contains model-derived total water levels (in meters) for the sea-level rise (SLR) and storm condition indicated. The Coastal Storm Modeling System (CoSMoS) makes detailed predictions (meter-scale) over large geographic scales (100s of kilometers) of storm-induced coastal flooding and erosion for both current and future sea-level rise (SLR) scenarios. Projections for CoSMoS v3.1 in Central California include flood-hazard information for the coast from Pt. Conception to the Golden Gate bridge. Outputs include SLR scenarios of 0.0, 0.25, 0.5, 0.75, 1.0, 1.5, 2.0, 2.5, 3.0, and 5.0 meters; storm scenarios include background conditions (astronomic spring tide and average atmospheric conditions) and simulated...
Categories: Data;
Types: Map Service,
OGC WFS Layer,
OGC WMS Layer,
OGC WMS Service;
Tags: Beaches,
CMHRP,
Central California,
Central California Coast,
Climate change,
This data contains maximum model-derived significant wave height (in meters) for the sea-level rise (SLR) and storm condition indicated. The Coastal Storm Modeling System (CoSMoS) makes detailed predictions (meter-scale) over large geographic scales (100s of kilometers) of storm-induced coastal flooding and erosion for both current and future sea-level rise (SLR) scenarios. Projections for CoSMoS v3.1 in Central California include flood-hazard information for the coast from Pt. Conception to the Golden Gate bridge. Outputs include SLR scenarios of 0.0, 0.25, 0.5, 0.75, 1.0, 1.5, 2.0, 2.5, 3.0, and 5.0 meters; storm scenarios include background conditions (astronomic spring tide and average atmospheric conditions)...
Categories: Data;
Types: Map Service,
OGC WFS Layer,
OGC WMS Layer,
OGC WMS Service;
Tags: Beaches,
CMHRP,
Central California,
Central California Coast,
Climate change,
This data contains maximum depth of flooding (cm) in the region landward of the present-day shoreline for the sea-level rise (SLR) and storm condition indicated. The Coastal Storm Modeling System (CoSMoS) makes detailed predictions (meter-scale) over large geographic scales (100s of kilometers) of storm-induced coastal flooding and erosion for both current and future sea-level rise (SLR) scenarios. Projections for CoSMoS v3.1 in Central California include flood-hazard information for the coast from Pt. Conception to the Golden Gate bridge. Outputs include SLR scenarios of 0.0, 0.25, 0.5, 0.75, 1.0, 1.5, 2.0, 2.5, 3.0, and 5.0 meters; storm scenarios include background conditions (astronomic spring tide and average...
Categories: Data;
Types: Map Service,
OGC WFS Layer,
OGC WMS Layer,
OGC WMS Service;
Tags: Beaches,
CMHRP,
Central California,
Central California Coast,
Climate change,
This part of DS 781 presents data for the transgressive contours for the depth-to-transition map of the Pigeon Point to Monterey, California, map region. The vector file is included in T "TransgressiveContours_PigeonPointToMonterey.zip," which is accessible from https://doi.org/10.5066/F7N29V0Z. As part of the USGS's California State Waters Mapping Project, a 50-m grid of sediment thickness for the seafloor within the limit of California’s State Waters between Pigeon Point and southern Monterey Bay was generated from seismic-reflection data collected in 2009 and 2010 (USGS activities (S-15-10-NC, S-N1-09-MB, and S-06-11-MB) supplemented with outcrop and geologic structure from DS 781. The resulting grid covers was...
Categories: Data;
Types: Downloadable,
Map Service,
OGC WFS Layer,
OGC WMS Layer,
Shapefile;
Tags: Ano Nuevo,
Aptos,
Distributions,
Marina,
Monterey,
This part of DS 781 presents data for the faults for the geologic and geomorphic map of the Offshore Pigeon Point map area, California. The vector data file is included in "Faults_OffshorePigeonPoint.zip," which is accessible from https://doi.org/10.5066/F7513W80. These data accompany the pamphlet and map sheets of Cochrane, G.R., Watt, J.T., Dartnell, P., Greene, H.G., Erdey, M.D., Dieter, B.E., Golden, N.E., Johnson, S.Y., Endris, C.A., Hartwell, S.R., Kvitek, R.G., Davenport, C.W., Krigsman, L.M., Ritchie, A.C., Sliter, R.W., Finlayson, D.P., and Maier, K.L. (G.R. Cochrane and S.A. Cochran, eds.), 2015, California State Waters Map Series—Offshore of Pigeon Point, California: U.S. Geological Survey Open-File Report...
Categories: Data;
Types: Downloadable,
Map Service,
OGC WFS Layer,
OGC WMS Layer,
Shapefile;
Tags: Bathymetry,
CMHRP,
Coastal and Marine Hazards and Resources Program,
Continental/Island Shelf,
Marine Nearshore Subtidal,
This part of DS 781 presents data for the folds for the geologic and geomorphic map of the Offshore Pigeon Point map area, California. The vector data file is included in "Folds_OffshorePigeonPoint.zip," which is accessible from https://doi.org/10.5066/F7513W80. These data accompany the pamphlet and map sheets of Cochrane, G.R., Watt, J.T., Dartnell, P., Greene, H.G., Erdey, M.D., Dieter, B.E., Golden, N.E., Johnson, S.Y., Endris, C.A., Hartwell, S.R., Kvitek, R.G., Davenport, C.W., Krigsman, L.M., Ritchie, A.C., Sliter, R.W., Finlayson, D.P., and Maier, K.L. (G.R. Cochrane and S.A. Cochran, eds.), 2015, California State Waters Map Series—Offshore of Pigeon Point, California: U.S. Geological Survey Open-File Report...
Categories: Data;
Types: Downloadable,
Map Service,
OGC WFS Layer,
OGC WMS Layer,
Shapefile;
Tags: Bathymetry,
CMHRP,
Coastal and Marine Hazards and Resources Program,
Continental/Island Shelf,
Marine Nearshore Subtidal,
Layered geospatial PDF 7.5 Minute Quadrangle Map. Layers of geospatial data include orthoimagery, roads, grids, geographic names, elevation contours, hydrography, and other selected map features. This map is derived from GIS (geospatial information system) data. It represents a repackaging of GIS data in traditional map form, not creation of new information. The geospatial data in this map are from selected National Map data holdings and other government sources.
|

|
