Filters: Tags: San Mateo County (X)
183 results (17ms)|
Filters
Date Range
Extensions Types Contacts
Categories Tag Types Tag Schemes |
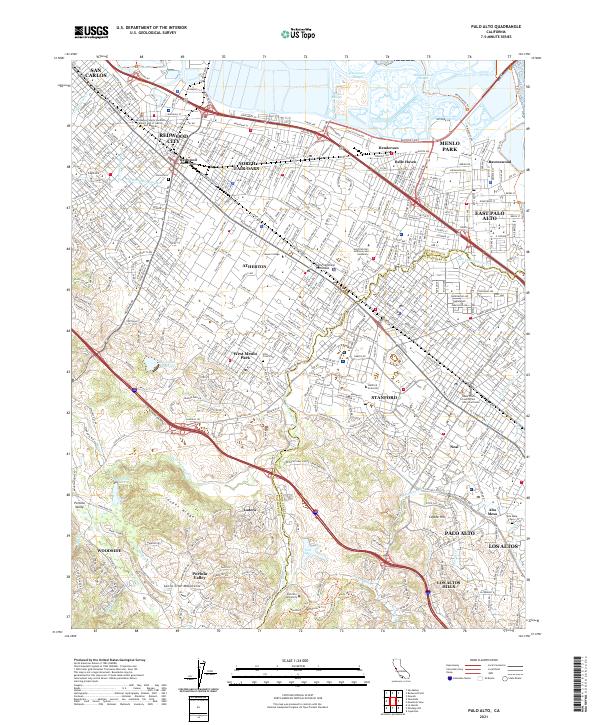
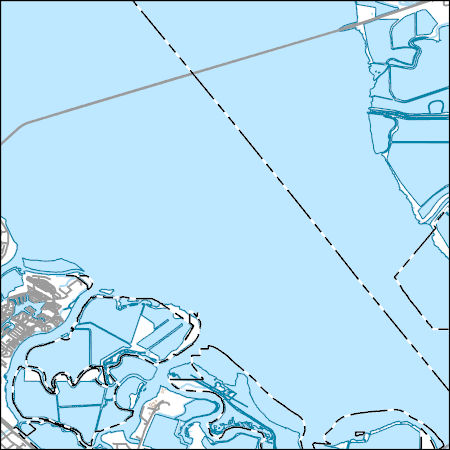
Layered geospatial PDF 7.5 Minute Quadrangle Map. Layers of geospatial data include orthoimagery, roads, grids, geographic names, elevation contours, hydrography, and other selected map features. This map is derived from GIS (geospatial information system) data. It represents a repackaging of GIS data in traditional map form, not creation of new information. The geospatial data in this map are from selected National Map data holdings and other government sources.
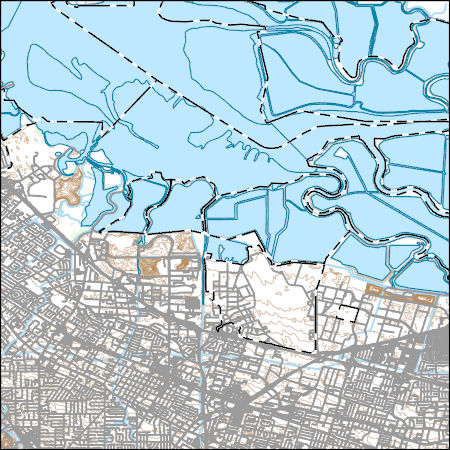
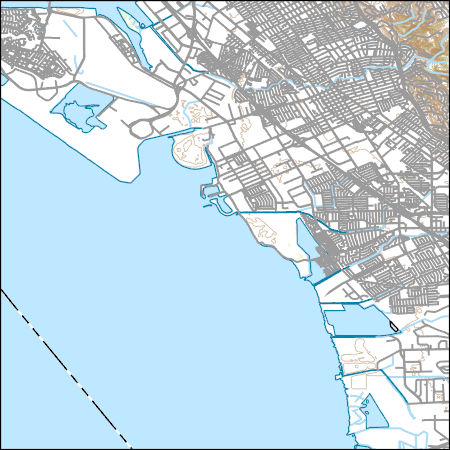
Layers of geospatial data include contours, boundaries, land cover, hydrography, roads, transportation, geographic names, structures, and other selected map features.
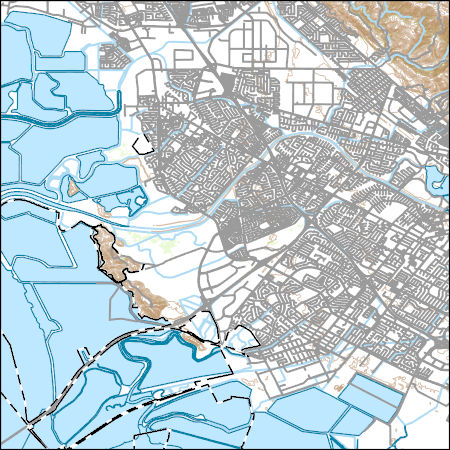
Layers of geospatial data include contours, boundaries, land cover, hydrography, roads, transportation, geographic names, structures, and other selected map features.
Layers of geospatial data include contours, boundaries, land cover, hydrography, roads, transportation, geographic names, structures, and other selected map features.
This data contains model-derived total water levels (in meters) for the sea-level rise (SLR) and storm condition indicated. The Coastal Storm Modeling System (CoSMoS) makes detailed predictions (meter-scale) over large geographic scales (100s of kilometers) of storm-induced coastal flooding and erosion for both current and future sea-level rise (SLR) scenarios. Projections for CoSMoS v3.1 in Central California include flood-hazard information for the coast from Pt. Conception to the Golden Gate bridge. Outputs include SLR scenarios of 0.0, 0.25, 0.5, 0.75, 1.0, 1.5, 2.0, 2.5, 3.0, and 5.0 meters; storm scenarios include background conditions (astronomic spring tide and average atmospheric conditions) and simulated...
Categories: Data;
Types: Map Service,
OGC WFS Layer,
OGC WMS Layer,
OGC WMS Service;
Tags: Beaches,
CMHRP,
Central California,
Central California Coast,
Climate change,
This data contains maximum model-derived ocean currents (in meters per second) for the sea-level rise (SLR) and storm condition indicated. The Coastal Storm Modeling System (CoSMoS) makes detailed predictions (meter-scale) over large geographic scales (100s of kilometers) of storm-induced coastal flooding and erosion for both current and future sea-level rise (SLR) scenarios. Projections for CoSMoS v3.1 in Central California include flood-hazard information for the coast from Pt. Conception to the Golden Gate bridge. Outputs include SLR scenarios of 0.0, 0.25, 0.5, 0.75, 1.0, 1.5, 2.0, 2.5, 3.0, and 5.0 meters; storm scenarios include background conditions (astronomic spring tide and average atmospheric conditions)...
Categories: Data;
Types: Map Service,
OGC WFS Layer,
OGC WMS Layer,
OGC WMS Service;
Tags: Beaches,
CMHRP,
Central California,
Central California Coast,
Climate change,
This data contains model-derived total water levels (in meters) for the sea-level rise (SLR) and storm condition indicated. The Coastal Storm Modeling System (CoSMoS) makes detailed predictions (meter-scale) over large geographic scales (100s of kilometers) of storm-induced coastal flooding and erosion for both current and future sea-level rise (SLR) scenarios. Projections for CoSMoS v3.1 in Central California include flood-hazard information for the coast from Pt. Conception to the Golden Gate bridge. Outputs include SLR scenarios of 0.0, 0.25, 0.5, 0.75, 1.0, 1.5, 2.0, 2.5, 3.0, and 5.0 meters; storm scenarios include background conditions (astronomic spring tide and average atmospheric conditions) and simulated...
Categories: Data;
Types: Map Service,
OGC WFS Layer,
OGC WMS Layer,
OGC WMS Service;
Tags: Beaches,
CMHRP,
Central California,
Central California Coast,
Climate change,
This data contains maximum model-derived significant wave height (in meters) for the sea-level rise (SLR) and storm condition indicated. The Coastal Storm Modeling System (CoSMoS) makes detailed predictions (meter-scale) over large geographic scales (100s of kilometers) of storm-induced coastal flooding and erosion for both current and future sea-level rise (SLR) scenarios. Projections for CoSMoS v3.1 in Central California include flood-hazard information for the coast from Pt. Conception to the Golden Gate bridge. Outputs include SLR scenarios of 0.0, 0.25, 0.5, 0.75, 1.0, 1.5, 2.0, 2.5, 3.0, and 5.0 meters; storm scenarios include background conditions (astronomic spring tide and average atmospheric conditions)...
Categories: Data;
Types: Map Service,
OGC WFS Layer,
OGC WMS Layer,
OGC WMS Service;
Tags: Beaches,
CMHRP,
Central California,
Central California Coast,
Climate change,
Adult female San Francisco gartersnakes (Thamnophis sirtalis tetrataenia) were captured and examined using an ultrasound device to determine if they were gravid and count the number of embryos in those that were. Morphological data including length and mass were collected for each snake, along with the date of capture and a study site identifier. These data support the following publication: Rose, J.P., Kim, R., Schoening, E.J., Lien, P.C., and Halstead, B.J., 2023. Comparing reintroduction strategies for the endangered San Francisco gartersnake (Thamnophis sirtalis tetrataenia) using demographic models. PLoS ONE 18(10): e0292379. https://doi.org/10.1371/journal.pone.0292379
Categories: Data;
Tags: Ecology,
San Mateo County,
USGS Science Data Catalog (SDC),
Wildlife Biology,
biota,

Layered geospatial PDF 7.5 Minute Quadrangle Map. Layers of geospatial data include orthoimagery, roads, grids, geographic names, elevation contours, hydrography, and other selected map features. This map is derived from GIS (geospatial information system) data. It represents a repackaging of GIS data in traditional map form, not creation of new information. The geospatial data in this map are from selected National Map data holdings and other government sources.
This part of DS 781 presents data for the acoustic-backscatter map of Offshore of Pigeon Point map area, California. Backscatter data are provided as three separate grids depending on mapping system. This metadata file refers to the data included in "BackscatterB_7125_OffshorePigeonPoint.zip," which is accessible from https://doi.org/10.5066/F7513W80. These data accompany the pamphlet and map sheets of Cochrane, G.R., Watt, J.T., Dartnell, P., Greene, H.G., Erdey, M.D., Dieter, B.E., Golden, N.E., Johnson, S.Y., Endris, C.A., Hartwell, S.R., Kvitek, R.G., Davenport, C.W., Krigsman, L.M., Ritchie, A.C., Sliter, R.W., Finlayson, D.P., and Maier, K.L. (G.R. Cochrane and S.A. Cochran, eds.), 2015, California State Waters...
Categories: Data;
Types: Downloadable,
GeoTIFF,
Map Service,
Raster;
Tags: Acoustic Reflectivity,
Ano Nuevo,
Backscatter,
CMHRP,
Coastal and Marine Hazards and Resources Program,
This part of DS 781 presents data for the bathymetric contours for several seafloor maps of the Offshore Pigeon Point map area, California. The vector data file is included in "Contours_OffshorePigeonPoint.zip", which is accessible from https://doi.org/10.5066/F7513W80. These data accompany the pamphlet and map sheets of Cochrane, G.R., Watt, J.T., Dartnell, P., Greene, H.G., Erdey, M.D., Dieter, B.E., Golden, N.E., Johnson, S.Y., Endris, C.A., Hartwell, S.R., Kvitek, R.G., Davenport, C.W., Krigsman, L.M., Ritchie, A.C., Sliter, R.W., Finlayson, D.P., and Maier, K.L. (G.R. Cochrane and S.A. Cochran, eds.), 2015, California State Waters Map Series—Offshore of Pigeon Point, California: U.S. Geological Survey Open-File...
Categories: Data;
Types: Downloadable,
Map Service,
OGC WFS Layer,
OGC WMS Layer,
Shapefile;
Tags: Ano Nuevo,
Bathymetry,
CMHRP,
Coastal and Marine Hazards and Resources Program,
Continental/Island Shelf,
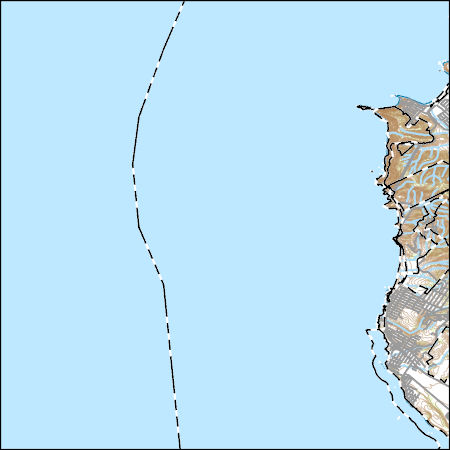
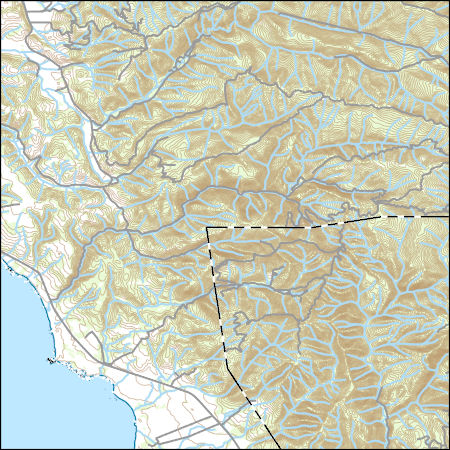
Layers of geospatial data include contours, boundaries, land cover, hydrography, roads, transportation, geographic names, structures, and other selected map features.
Layers of geospatial data include contours, boundaries, land cover, hydrography, roads, transportation, geographic names, structures, and other selected map features.
Layers of geospatial data include contours, boundaries, land cover, hydrography, roads, transportation, geographic names, structures, and other selected map features.
This data contains maximum model-derived ocean currents (in meters per second) for the sea-level rise (SLR) and storm condition indicated. The Coastal Storm Modeling System (CoSMoS) makes detailed predictions (meter-scale) over large geographic scales (100s of kilometers) of storm-induced coastal flooding and erosion for both current and future sea-level rise (SLR) scenarios. Projections for CoSMoS v3.1 in Central California include flood-hazard information for the coast from Pt. Conception to the Golden Gate bridge. Outputs include SLR scenarios of 0.0, 0.25, 0.5, 0.75, 1.0, 1.5, 2.0, 2.5, 3.0, and 5.0 meters; storm scenarios include background conditions (astronomic spring tide and average atmospheric conditions)...
Categories: Data;
Types: Map Service,
OGC WFS Layer,
OGC WMS Layer,
OGC WMS Service;
Tags: Beaches,
CMHRP,
Central California,
Central California Coast,
Climate change,
This data contains model-derived total water levels (in meters) for the sea-level rise (SLR) and storm condition indicated. The Coastal Storm Modeling System (CoSMoS) makes detailed predictions (meter-scale) over large geographic scales (100s of kilometers) of storm-induced coastal flooding and erosion for both current and future sea-level rise (SLR) scenarios. Projections for CoSMoS v3.1 in Central California include flood-hazard information for the coast from Pt. Conception to the Golden Gate bridge. Outputs include SLR scenarios of 0.0, 0.25, 0.5, 0.75, 1.0, 1.5, 2.0, 2.5, 3.0, and 5.0 meters; storm scenarios include background conditions (astronomic spring tide and average atmospheric conditions) and simulated...
Categories: Data;
Types: Map Service,
OGC WFS Layer,
OGC WMS Layer,
OGC WMS Service;
Tags: Beaches,
CMHRP,
Central California,
Central California Coast,
Climate change,
This data contains maximum depth of flooding (cm) in the region landward of the present-day shoreline for the sea-level rise (SLR) and storm condition indicated. The Coastal Storm Modeling System (CoSMoS) makes detailed predictions (meter-scale) over large geographic scales (100s of kilometers) of storm-induced coastal flooding and erosion for both current and future sea-level rise (SLR) scenarios. Projections for CoSMoS v3.1 in Central California include flood-hazard information for the coast from Pt. Conception to the Golden Gate bridge. Outputs include SLR scenarios of 0.0, 0.25, 0.5, 0.75, 1.0, 1.5, 2.0, 2.5, 3.0, and 5.0 meters; storm scenarios include background conditions (astronomic spring tide and average...
Categories: Data;
Types: Map Service,
OGC WFS Layer,
OGC WMS Layer,
OGC WMS Service;
Tags: Beaches,
CMHRP,
Central California,
Central California Coast,
Climate change,
|

|
