Filters: Tags: Santa Barbara County (X)
426 results (531ms)|
Filters
Date Range
Extensions Types Contacts
Categories Tag Types
|
Layers of geospatial data include contours, boundaries, land cover, hydrography, roads, transportation, geographic names, structures, and other selected map features.
Layers of geospatial data include contours, boundaries, land cover, hydrography, roads, transportation, geographic names, structures, and other selected map features.
Layers of geospatial data include contours, boundaries, land cover, hydrography, roads, transportation, geographic names, structures, and other selected map features.
Layers of geospatial data include contours, boundaries, land cover, hydrography, roads, transportation, geographic names, structures, and other selected map features.
Layers of geospatial data include contours, boundaries, land cover, hydrography, roads, transportation, geographic names, structures, and other selected map features.
Layers of geospatial data include contours, boundaries, land cover, hydrography, roads, transportation, geographic names, structures, and other selected map features.
Layers of geospatial data include contours, boundaries, land cover, hydrography, roads, transportation, geographic names, structures, and other selected map features.
Layers of geospatial data include contours, boundaries, land cover, hydrography, roads, transportation, geographic names, structures, and other selected map features.
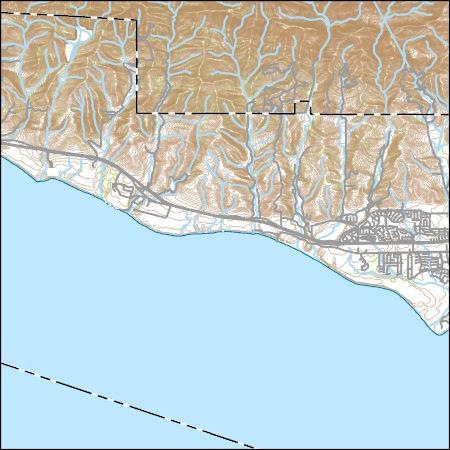
Layers of geospatial data include contours, boundaries, land cover, hydrography, roads, transportation, geographic names, structures, and other selected map features.
LUCAS-W is a scenario-based simulation model of coupled land use change and associated water demand for California's Central Coast region from 2001-2061. The model is a verison of the LUCAS model, which uses the SyncroSim software framework (Software documentation available at http://doc.syncrosim.com/index.php?title=Reference_Guide), that contains a new coupling with statistical software R (https://www.r-project.org/) to enable dynamic feedbacks between land-use change, resulting water demand, and water availability. The model was parameterized with land-use change and water use empirically estimated from county-scale historic data, as well as results from dozens of local agencies’ groundwater modeling efforts....
Categories: Data;
Types: Map Service,
OGC WFS Layer,
OGC WMS Layer,
OGC WMS Service;
Tags: Central California Coast,
Ecology,
LUCAS Model,
Land Use Change,
Monterey County,

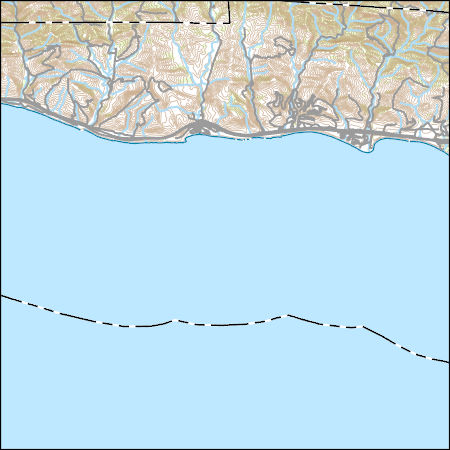
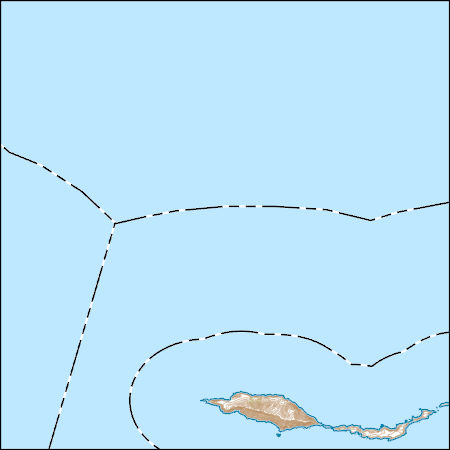
This part of DS 781 presents data for the transgressive contours for the Point Conception to Hueneme Canyon, California, region. The vector file is included in "TransgressiveContours_PointConceptionToHuenemeCanyon.zip," which is accessible from http://dx.doi.org/10.5066/F7891424. As part of the USGS's California State Waters Mapping Project, a 50-m grid of sediment thickness for the seafloor within the 3-nautical mile limit between Point Conception and Hueneme Canyon was generated from seismic-reflection data collected in 2014 (USGS activity 2014-632-FA) supplemented with outcrop and geologic structure (fault) information following the methodology of Wong (2012). Water depths determined from bathymetry data were...
Categories: Data;
Types: Citation,
Downloadable,
Map Service,
OGC WFS Layer,
OGC WMS Layer,
Shapefile;
Tags: Carpinteria,
Coal Oil Point,
Gaviota,
Hueneme Canyon,
Pacific Ocean,

This part of DS 781 presents data for the isopachs for the Point Conception to Hueneme Canyon, California, region. The vector data file is included in "Isopachs_PointConceptionToHuenemeCanyon.zip," which is accessible from https://doi.org/10.5066/F7891424. As part of the USGS's California State Waters Mapping Project, a 50-m grid of sediment thickness for the seafloor within the 3-nautical mile limit between Point Conception and Hueneme Canyon was generated from seismic-reflection data collected in 2014 (USGS activity 2014-632-FA) supplemented with outcrop and geologic structure (fault) information following the methodology of Wong (2012). This sediment thickness layer was merged with a previously published sediment...
Categories: Data;
Types: Citation,
Downloadable,
Map Service,
OGC WFS Layer,
OGC WMS Layer,
Shapefile;
Tags: Carpinteria,
Coal Oil Point,
Gaviota,
Hueneme Canyon,
Pacific Ocean,
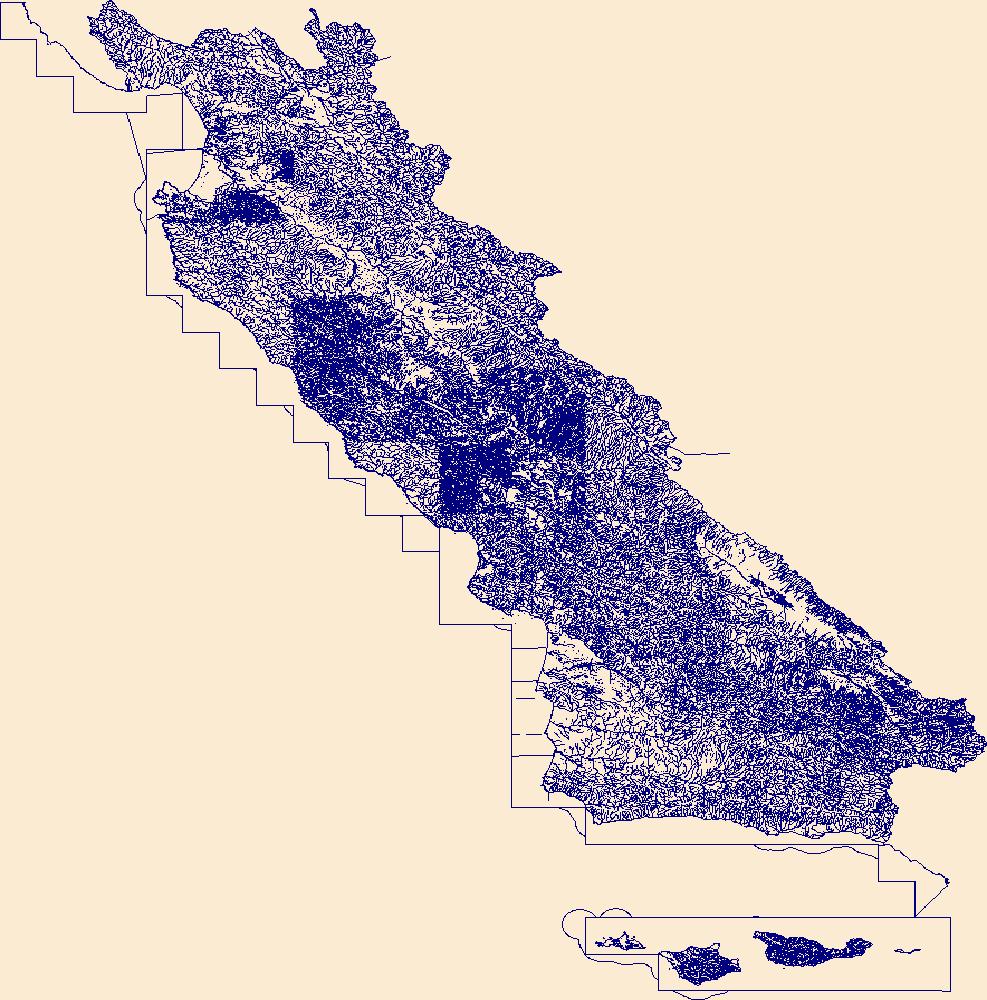
The High Resolution National Hydrography Dataset Plus (NHDPlus HR) is an integrated set of geospatial data layers, including the best available National Hydrography Dataset (NHD), the 10-meter 3D Elevation Program Digital Elevation Model (3DEP DEM), and the National Watershed Boundary Dataset (WBD). The NHDPlus HR combines the NHD, 3DEP DEMs, and WBD to create a stream network with linear referencing, feature naming, "value added attributes" (VAAs), elevation-derived catchments, and other features for hydrologic data analysis. The stream network with linear referencing is a system of data relationships applied to hydrographic systems so that one stream reach "flows" into another and "events" can be tied to and traced...

These data were released prior to the October 1, 2016 effective date for the USGS’s policy dictating the review, approval, and release of scientific data as referenced in USGS Survey Manual Chapter 502.8 Fundamental Science Practices: Review and Approval of Scientific Data for Release. This digital dataset contains the virtual wells used for urban (municipal and industrial use) pumpage for the Central Valley Hydrologic Model (CVHM). The Central Valley encompasses an approximate 50,000 square-kilometer region of California. The complex hydrologic system of the Central Valley is simulated using the U.S. Geological Survey (USGS) numerical modeling code MODFLOW-FMP (Schmid and others, 2006). This application is referred...

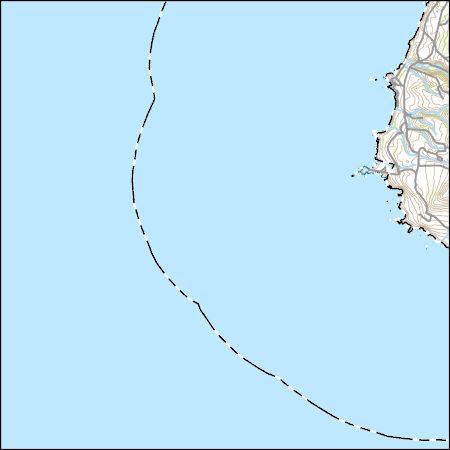
This part of DS 781 presents data for bathymetric contours for several seafloor maps of the Offshore of Point Conception Map Area, California. The vector data file is included in "Contours_OffshorePointConception.zip," which is accessible from https://doi.org/10.5066/F7QN64XQ. Bathymetry contours of the Offshore of Point Conception map area in southern California was generated from acoustic-bathymetry data collected by Fugro Pelagos Inc. Acoustic mapping was completed in 2008 using a combination of 400-kHz Reson 7125, 240-kHz Reson 8101, and 100-kHz Reson 8111 multibeam echosounders. Bathymetric-lidar data was collected in the nearshore area by the U.S. Army Corps of Engineers (USACE) Joint Lidar Bathymetry Technical...

This part of DS 781 presents data for bathymetry for several seafloor maps of the Offshore of Point Conception Map Area, California. The GeoTiff is included in "Bathymetry_OffshorePointConception.zip," which is accessible from https://doi.org/10.5066/F7QN64XQ. Bathymetry map of the Offshore of Point Conception map area in southern California was generated largely from acoustic-bathymetry data collected by Fugro Pelagos Inc. Acoustic mapping was completed in 2008 using a combination of 400-kHz Reson 7125, 240-kHz Reson 8101, and 100-kHz Reson 8111 multibeam echosounders. Bathymetric-lidar data was collected in the nearshore area by the U.S. Army Corps of Engineers (USACE) Joint Lidar Bathymetry Technical Center of...
Each month (except March 2012), we collected detailed data on the infection status of intertidal snails from ten fixed sites as part of a broader effort to understand food webs in California Estuaries. The study site was Carpinteria Salt Marsh Reserve, California USA, (University of California Natural Reserve System), which comprises 9 Ha tidal channels, 2 Ha salt flats, 17 Ha upland habitat, 6 Ha tidal pans, 52 Ha vegetated marsh, 2 Ha tidal flats. Each site was a fixed location in channel or flat habitat, with a diameter approximately 50 m in size, centered at the site location marker used in Kuris et al. (2008). At each site/month, we collected, measured, sexed, and dissected ~58 snails (11,643 dissections total,...
Categories: Data;
Tags: California,
Carpinteria,
Carpinteria Salt Marsh Reserve,
Santa Barbara County,
USGS Science Data Catalog (SDC),
Each month (except March 2012), we collected detailed data on the density, size distribution, and infection status of intertidal snails from ten fixed sites as part of a broader effort to understand food webs in California Estuaries. The study site was Carpinteria Salt Marsh Reserve, California USA, (University of California Natural Reserve System), which comprises 9 Ha tidal channels, 2 Ha salt flats, 17 Ha upland habitat, 6 Ha tidal pans, 52 Ha vegetated marsh, 2 Ha tidal flats. Each site was a fixed location in channel or flat habitat, with a diameter approximately 50m in size, centered at the site location marker used in Kuris et al. (2008). At each site/month, we collected, measured, sexed, and dissected ~58...
Categories: Data;
Tags: California,
Carpinteria,
Carpinteria Salt Marsh Reserve,
Santa Barbara County,
USGS Science Data Catalog (SDC),
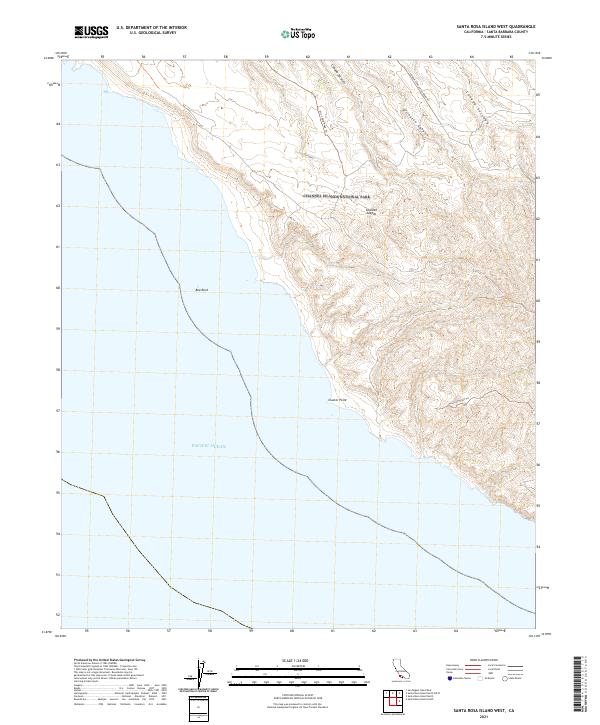
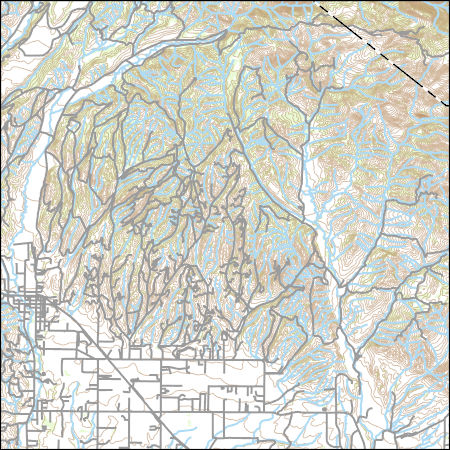
Layered geospatial PDF 7.5 Minute Quadrangle Map. Layers of geospatial data include orthoimagery, roads, grids, geographic names, elevation contours, hydrography, and other selected map features. This map is derived from GIS (geospatial information system) data. It represents a repackaging of GIS data in traditional map form, not creation of new information. The geospatial data in this map are from selected National Map data holdings and other government sources.
Layered geospatial PDF 7.5 Minute Quadrangle Map. Layers of geospatial data include orthoimagery, roads, grids, geographic names, elevation contours, hydrography, and other selected map features. This map is derived from GIS (geospatial information system) data. It represents a repackaging of GIS data in traditional map form, not creation of new information. The geospatial data in this map are from selected National Map data holdings and other government sources.
|

|
