Filters: Tags: Schoharie County (X)
72 results (66ms)|
Filters
Contacts
(Less)
|
Line creek, Mill Valley Rd.
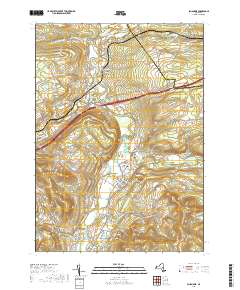
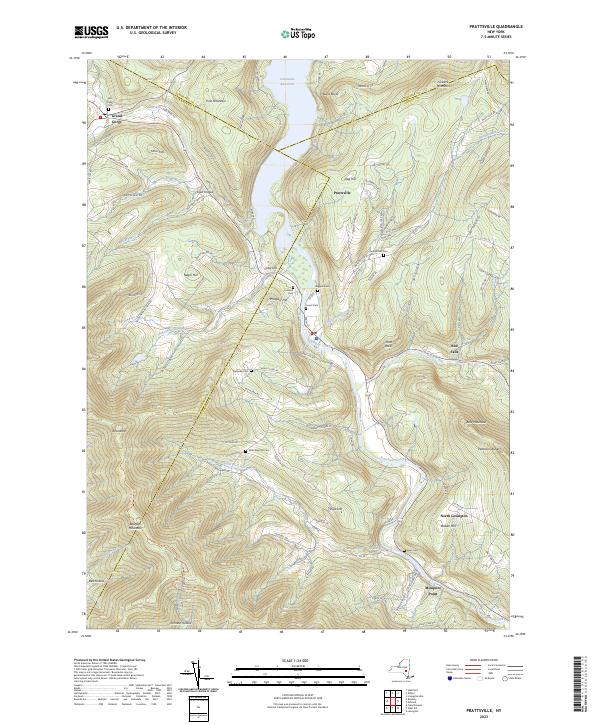
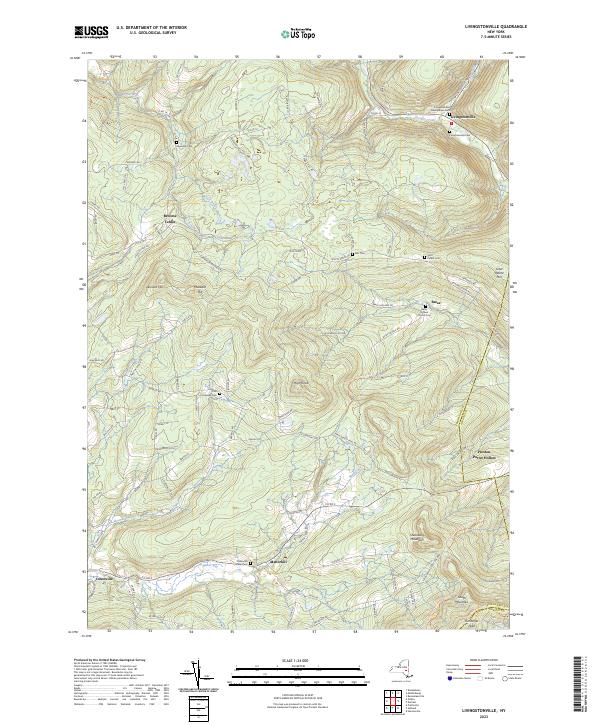
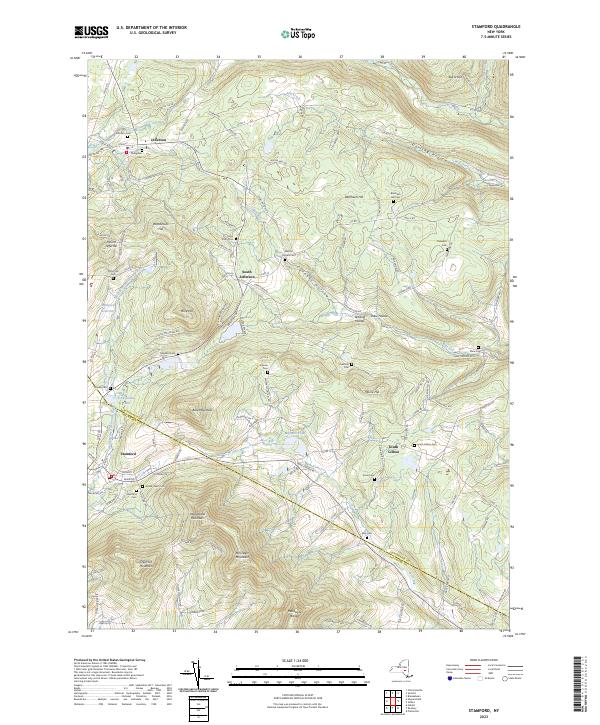
Layered geospatial PDF 7.5 Minute Quadrangle Map. Layers of geospatial data include orthoimagery, roads, grids, geographic names, elevation contours, hydrography, and other selected map features. This map is derived from GIS (geospatial information system) data. It represents a repackaging of GIS data in traditional map form, not creation of new information. The geospatial data in this map are from selected National Map data holdings and other government sources.
Layered geospatial PDF 7.5 Minute Quadrangle Map. Layers of geospatial data include orthoimagery, roads, grids, geographic names, elevation contours, hydrography, and other selected map features. This map is derived from GIS (geospatial information system) data. It represents a repackaging of GIS data in traditional map form, not creation of new information. The geospatial data in this map are from selected National Map data holdings and other government sources.
Line creek, Mill Valley Rd.
From 2013 to 2015, bathymetric surveys of New York City’s six West of Hudson reservoirs (Ashokan, Cannonsville, Neversink, Pepacton, Rondout, and Schoharie) were performed to provide updated capacity tables and bathymetric maps. Depths were surveyed with a single-beam echo sounder and real-time kinematic global positioning system (RTK-GPS) along planned transects at predetermined intervals for each reservoir. A separate set of echo sounder data was collected along transects at oblique angles to the main transects for accuracy assessment. Field survey data was combined with water-surface elevations in a geographic information system to create three-dimensional surfaces representing reservoir-bed elevations in the...
Categories: Data;
Types: Citation,
Downloadable,
Map Service,
OGC WFS Layer,
OGC WMS Layer,
Shapefile;
Tags: Delaware County,
GPS measurement,
Greene County,
Schoharie County,
Schoharie Reservoir,
From 2013 to 2015, bathymetric surveys of New York City’s six West of Hudson reservoirs (Ashokan, Cannonsville, Neversink, Pepacton, Rondout, and Schoharie) were performed to provide updated capacity tables and bathymetric maps. Depths were surveyed with a single-beam echo sounder and real-time kinematic global positioning system (RTK-GPS) along planned transects at predetermined intervals for each reservoir. A separate set of echo sounder data was collected along transects at oblique angles to the main transects for accuracy assessment. Field survey data was combined with water-surface elevations in a geographic information system to create three-dimensional surfaces representing reservoir-bed elevations in the...
Categories: Data;
Types: Citation;
Tags: Delaware County,
GPS measurement,
Greene County,
Schoharie County,
Schoharie Reservoir,
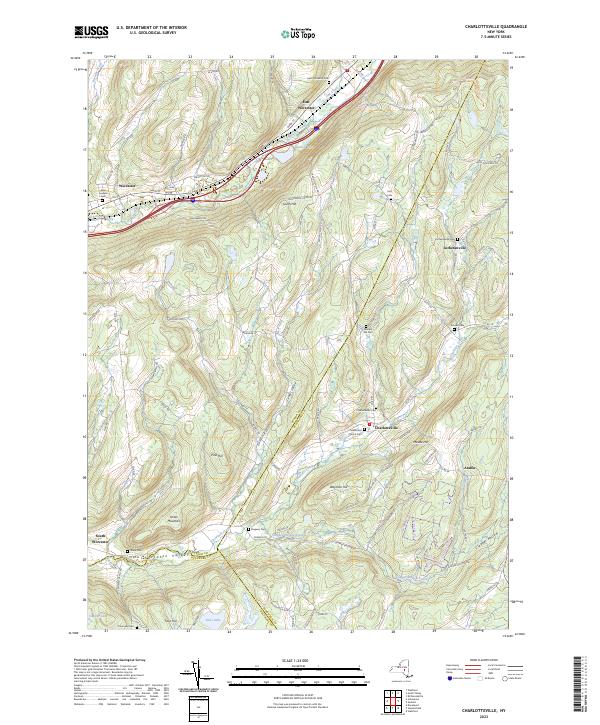
Layered geospatial PDF 7.5 Minute Quadrangle Map. Layers of geospatial data include orthoimagery, roads, grids, geographic names, elevation contours, hydrography, and other selected map features. This map is derived from GIS (geospatial information system) data. It represents a repackaging of GIS data in traditional map form, not creation of new information. The geospatial data in this map are from selected National Map data holdings and other government sources.
Layered geospatial PDF 7.5 Minute Quadrangle Map. Layers of geospatial data include orthoimagery, roads, grids, geographic names, elevation contours, hydrography, and other selected map features. This map is derived from GIS (geospatial information system) data. It represents a repackaging of GIS data in traditional map form, not creation of new information. The geospatial data in this map are from selected National Map data holdings and other government sources.
Layered geospatial PDF 7.5 Minute Quadrangle Map. Layers of geospatial data include orthoimagery, roads, grids, geographic names, elevation contours, hydrography, and other selected map features. This map is derived from GIS (geospatial information system) data. It represents a repackaging of GIS data in traditional map form, not creation of new information. The geospatial data in this map are from selected National Map data holdings and other government sources.
Layered geospatial PDF 7.5 Minute Quadrangle Map. Layers of geospatial data include orthoimagery, roads, grids, geographic names, elevation contours, hydrography, and other selected map features. This map is derived from GIS (geospatial information system) data. It represents a repackaging of GIS data in traditional map form, not creation of new information. The geospatial data in this map are from selected National Map data holdings and other government sources.
Line creek, Mill Valley Rd.
Line creek, Mill Valley Rd.
Digital flood-inundation maps for a 2.4-mile reach of the Schoharie Creek in North Blenheim, New York, were created by the U.S. Geological Survey (USGS) in cooperation with the New York Power Authority. The flood-inundation maps, which can be accessed through the USGS Flood Inundation Mapping Science web site at https://fim.wim.usgs.gov/fim/, depict estimates of the areal extent and depth of flooding corresponding to selected water levels (stages) at the USGS streamgage on the Schoharie Creek near North Blenheim, NY (station number 01350212). Flood profiles were computed for the stream reach by means of a two-dimensional implicit finite volume hydraulic model. The model was calibrated using the active (as of April,...
From July through December 2016, 56 environmental samples were collected from the Mohawk and Western New York River Basins. Samples were collected from nine production wells and 13 domestic wells in the Mohawk River Basin, and 17 production wells and 17 domestic wells in the Western New York River Basins. Samples were collected and processed using standard USGS methods and analyzed for 320 constituents including physicochemical properties, dissolved gases, major ions, nutrients, trace elements, pesticides, volatile organic compounds, radionuclides, and indicator bacteria. Analytical methods are described and referenced in Gaige and others (2023). Five of the Mohawk River Basin wells (HE 622, HE 624, OE1468, SA1501,...
Categories: Data;
Types: Map Service,
OGC WFS Layer,
OGC WMS Layer,
OGC WMS Service;
Tags: Albany County,
Allegany County,
Ambient Monitoring,
Cattaraugus County,
Chautauqua County,
Layered geospatial PDF 7.5 Minute Quadrangle Map. Layers of geospatial data include orthoimagery, roads, grids, geographic names, elevation contours, hydrography, and other selected map features. This map is derived from GIS (geospatial information system) data. It represents a repackaging of GIS data in traditional map form, not creation of new information. The geospatial data in this map are from selected National Map data holdings and other government sources.
This child item data set contains grids of water surface elevation for inundated areas derived from flood-inundation maps for the Schoharie Creek in North Blenheim, New York.
Categories: Data;
Types: Downloadable,
GeoTIFF,
Map Service,
Raster;
Tags: Flood Hazards,
Flood Inundation,
Flood Science,
Groundwater and Streamflow Information,
New York State,
Using publicly available data for Schoharie and Montgomery counties, New York, a series of geospatial overlays were created at 1:24,000 scale to examine the bedrock geology, groundwater table, soils, and surficial geology. Bedrock and surficial geology were refined using extant bedrock maps, well and borehole data from water- and gas-wells, soil data, and lidar data. Groundwater data were collected from New York State Department of Environmental Conservation and U.S. Geological Survey water-well databases to estimate the groundwater table. Soil data were used to examine soil thickness over bedrock and infiltration. An inventory of closed depressions was created using reconditioned lidar-derived bare-earth digital...
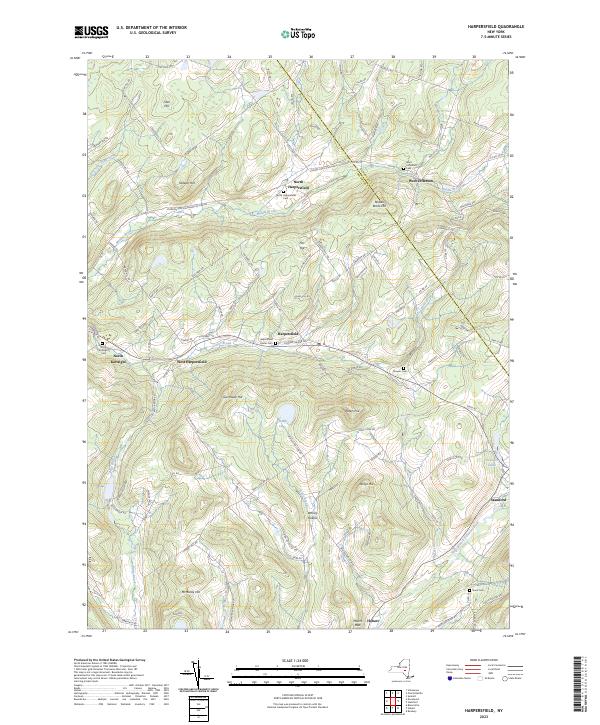
Layered geospatial PDF 7.5 Minute Quadrangle Map. Layers of geospatial data include orthoimagery, roads, grids, geographic names, elevation contours, hydrography, and other selected map features. This map is derived from GIS (geospatial information system) data. It represents a repackaging of GIS data in traditional map form, not creation of new information. The geospatial data in this map are from selected National Map data holdings and other government sources.
Layered geospatial PDF 7.5 Minute Quadrangle Map. Layers of geospatial data include orthoimagery, roads, grids, geographic names, elevation contours, hydrography, and other selected map features. This map is derived from GIS (geospatial information system) data. It represents a repackaging of GIS data in traditional map form, not creation of new information. The geospatial data in this map are from selected National Map data holdings and other government sources.
From July through November 2018, 48 environmental samples and four quality-control samples were collected throughout the Lower Hudson, Chemung, and Eastern Lake Ontario River Basins. Samples were collected from seven production wells and eight domestic wells in the Eastern Lake Ontario Basin, 13 production wells and 12 domestic wells in the Lower Hudson River Basin, and four production wells and four domestic wells in the Chemung River Basin. Of the wells sampled, 27 were completed in bedrock and 21 were completed in sand and gravel. Approximately 20 percent of samples were collected from wells that were previously sampled in 2003, 2008, and 2013. Groundwater samples were collected prior to any treatment or filtration...
Categories: Data;
Types: Map Service,
OGC WFS Layer,
OGC WMS Layer,
OGC WMS Service;
Tags: Albany County,
Allegany County,
Ambient Monitoring,
Chemung County,
Chemung River Basin,
|

|
