Filters: Tags: Species (X)
784 results (69ms)|
Filters
Date Range
Extensions
Types
Contacts
Categories
Tag Types
|
Periphyton is a complex community of detritus, bacteria, fungi, and algae that grows attached to submerged substrates. Assemblage structure data for algae and cyanobacteria from periphyton samples were collected on a monthly basis from 2017 to 2021. Compiled data were reported as absolute abundance (cells) and biovolume per volume as well as absolute abundance (cells) and biovolume per area at four locations increasing in distance East of the L-67 canal in Water Conservation Area 3 (WCA 3) of the Florida Everglades immediately north of Everglades National Park. The periphyton assemblages were analyzed for five sample types including periphyton plates (Plates), invertebrate inclusion and exclusion plates (Inverts),...
Categories: Data;
Tags: Aquatic Biology,
Ecology,
Everglades National Park,
USGS Science Data Catalog (SDC),
Water Quality,
This paper investigates the potential for systematic errors in the Energy Information Administration’s (EIA) widely used Annual Energy Outlook, focusing on the near- to midterm projections of energy demand. Based on analysis of the EIA’s 22-year projection record, we find a fairly modest but persistent tendency to underestimate total energy demand by an average of 2 percent per year after controlling for projection errors in gross domestic product, oil prices, and heating/cooling degree days. For 14 individual fuels/consuming sectors routinely reported by the EIA, we observe a great deal of directional consistency in the errors over time, ranging up to 7 percent per year. Electric utility renewables, electric utility...
Categories: Publication;
Types: Citation;
Tags: Powder River Basin,
coalbed natural gas,
communities,
deposits,
natural gas,
Offshore exploration and production of oil and gas have increased significantly in the last decade. Computer models are used in emergency response, contingency planning, and impact assessment to simulate the behavior of oil and gas if accidentally released from a well, pipeline, or ship. There are two types of models used for this purpose-models that have both plume dynamics stage and the advection diffusion stage and models that are of simplified nature that has only the advection diffusion stage. This paper compares both types of models and shows what information are similar and what are different and under what conditions. The paper also examines in detail about different criteria that can be used as the transition...
Categories: Publication;
Types: Citation;
Tags: balancing,
historical,
perspective,
protected,
role,

Species occurrence data were obtained from the Atlas of Spawning and Nursery Areas of Great Lakes Fishes (Goodyear et al. 1982). The atlas contains information on all of the commercially and recreationally important species that use the tributaries, littoral and open-water areas of the Great Lakes as spawning and nursery habitats. Close to 9500 geo-referenced data records (occurrences of fish species) were imported into ArcView GIS. The 139 fish taxa reported in the Atlas had to be grouped into fewer broad categories to produce meaningful distribution maps. We chose three functional classification schemes. Jude and Pappas (1992) used Correspondence Analysis to partition fish species associated with the open...

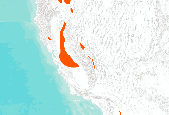
The source of this coverage data set is the fish biodiversity maps created for The Nature Conservancy (TNC) as part of their Hexagon Project. Professor Peter Moyle and his graduate student, Paul Randall, of the Department of Wildlife and Fisheries Conservation Biology at the University of California, Davis were hired to produce range maps for all known fish species that presently occur in California. Each coverage denotes a separate fish species (refer to the species coverage key below). The polygons are estimated to be accurate at a scale of roughly 1:1,000,000. Other California fish species distributions can be found in a gallery at: http://app.databasin.org/app/pages/galleryPage.jsp?id=099b47b7394f47b6b42764829e8a8f09

The source of this coverage data set is the fish biodiversity maps created for The Nature Conservancy (TNC) as part of their Hexagon Project. Professor Peter Moyle and his graduate student, Paul Randall, of the Department of Wildlife and Fisheries Conservation Biology at the University of California, Davis were hired to produce range maps for all known fish species that presently occur in California. Each coverage denotes a separate fish species (refer to the species coverage key below). The polygons are estimated to be accurate at a scale of roughly 1:1,000,000. Other California fish species distributions can be found in a gallery at: http://app.databasin.org/app/pages/galleryPage.jsp?id=099b47b7394f47b6b42764829e8a8f09

The source of this coverage data set is the fish biodiversity maps created for The Nature Conservancy (TNC) as part of their Hexagon Project. Professor Peter Moyle and his graduate student, Paul Randall, of the Department of Wildlife and Fisheries Conservation Biology at the University of California, Davis were hired to produce range maps for all known fish species that presently occur in California. Each coverage denotes a separate fish species (refer to the species coverage key below). The polygons are estimated to be accurate at a scale of roughly 1:1,000,000. Other California fish species distributions can be found in a gallery at: http://app.databasin.org/app/pages/galleryPage.jsp?id=099b47b7394f47b6b42764829e8a8f09

These data identify the areas (in general) where critical habitat for tidewater goby occurs. Critical habitat for the species consists of approximately 10,000 acres among 44 units distributed along the coast from Los Angeles County northward to Del Norte County, California.

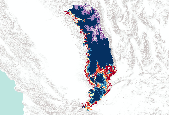
These data identify, in general, the areas where final critical habitat for the San Diego fairy shrimp (Branchinecta sandiegonensis) occur.

The source of this coverage data set is the fish biodiversity maps created for The Nature Conservancy (TNC) as part of their Hexagon Project. Professor Peter Moyle and his graduate student, Paul Randall, of the Department of Wildlife and Fisheries Conservation Biology at the University of California, Davis were hired to produce range maps for all known fish species that presently occur in California. Each coverage denotes a separate fish species (refer to the species coverage key below). The polygons are estimated to be accurate at a scale of roughly 1:1,000,000. Other California fish species distributions can be found in a gallery at: http://app.databasin.org/app/pages/galleryPage.jsp?id=099b47b7394f47b6b42764829e8a8f09
The source of this coverage data set is the fish biodiversity maps created for The Nature Conservancy (TNC) as part of their Hexagon Project. Professor Peter Moyle and his graduate student, Paul Randall, of the Department of Wildlife and Fisheries Conservation Biology at the University of California, Davis were hired to produce range maps for all known fish species that presently occur in California. Each coverage denotes a separate fish species (refer to the species coverage key below). The polygons are estimated to be accurate at a scale of roughly 1:1,000,000. Other California fish species distributions can be found in a gallery at: http://app.databasin.org/app/pages/galleryPage.jsp?id=099b47b7394f47b6b42764829e8a8f09

The source of this coverage data set is the fish biodiversity maps created for The Nature Conservancy (TNC) as part of their Hexagon Project. Professor Peter Moyle and his graduate student, Paul Randall, of the Department of Wildlife and Fisheries Conservation Biology at the University of California, Davis were hired to produce range maps for all known fish species that presently occur in California. Each coverage denotes a separate fish species (refer to the species coverage key below). The polygons are estimated to be accurate at a scale of roughly 1:1,000,000. Other California fish species distributions can be found in a gallery at: http://app.databasin.org/app/pages/galleryPage.jsp?id=099b47b7394f47b6b42764829e8a8f09

The source of this coverage data set is the fish biodiversity maps created for The Nature Conservancy (TNC) as part of their Hexagon Project. Professor Peter Moyle and his graduate student, Paul Randall, of the Department of Wildlife and Fisheries Conservation Biology at the University of California, Davis were hired to produce range maps for all known fish species that presently occur in California. Each coverage denotes a separate fish species (refer to the species coverage key below). The polygons are estimated to be accurate at a scale of roughly 1:1,000,000. Other California fish species distributions can be found in a gallery at: http://app.databasin.org/app/pages/galleryPage.jsp?id=099b47b7394f47b6b42764829e8a8f09

The source of this coverage data set is the fish biodiversity maps created for The Nature Conservancy (TNC) as part of their Hexagon Project. Professor Peter Moyle and his graduate student, Paul Randall, of the Department of Wildlife and Fisheries Conservation Biology at the University of California, Davis were hired to produce range maps for all known fish species that presently occur in California. Each coverage denotes a separate fish species (refer to the species coverage key below). The polygons are estimated to be accurate at a scale of roughly 1:1,000,000. Other California fish species distributions can be found in a gallery at: http://app.databasin.org/app/pages/galleryPage.jsp?id=099b47b7394f47b6b42764829e8a8f09

These data identify, in general, the areas where final critical habitat for ACANTHAMINTHA ILICIFOLIA (SAN DIEGO THORNMINT) occur.

This dataset represents presence of Black Spruce (Picea mariana) at year 100 (2095) from a single model run of LANDIS-II. The simulation assumed Intergovernmental Panel on Climate Change (IPCC) B2 emissions (moderate) and used the Hadley 3 global circulation model. Contemporary harvest rates and intensities were simulated.

Number of seagrass species, by marine ecoregion. We extracted seagrasses from version 2.0 of the global polygon and point data set that was compiled by UNEP-WCMC in 2005 (for more information about the source data set, e-mail spatialanalysis@unep-wcmc.org). These same data were originally published in the World Atlas of Seagrasses (Green and Short 2003; see, in particular, the chapter by Spalding et al. 2003). The source data for the habitat map were a mix of point and polygon information gathered from a major literature review as well as from national-level mapping programs. We developed the species diversity map from range maps drawn for fifty-five species. The four species from the genus Ruppia were not mapped...
The Nature Conservancy (TNC) has derived climate suitability forecasts for most species of trees and shrubs considered to be ecological dominants of terrestrial Californian habitat types. Our plant projections are compiled as decision support tools to help Conservancy project staff, as well as our external partners, develop the necessary plans, priorities and strategies to successfully adapt to uncertain changes in future climate. In the recently completed Southern Sierra Partnership's 2010 Climate-Adapted Conservation Plan for the Southern Sierra Nevada and Tehachapi Mountains, species and habitat forecasts shown here informed the development of a regional conservation design that explicitly incorporates long-term...

The Nature Conservancy (TNC) has derived climate suitability forecasts for most species of trees and shrubs considered to be ecological dominants of terrestrial Californian habitat types. Our plant projections are compiled as decision support tools to help Conservancy project staff, as well as our external partners, develop the necessary plans, priorities and strategies to successfully adapt to uncertain changes in future climate. In the recently completed Southern Sierra Partnership's 2010 Climate-Adapted Conservation Plan for the Southern Sierra Nevada and Tehachapi Mountains, species and habitat forecasts shown here informed the development of a regional conservation design that explicitly incorporates long-term...

The Nature Conservancy (TNC) has derived climate suitability forecasts for most species of trees and shrubs considered to be ecological dominants of terrestrial Californian habitat types. Our plant projections are compiled as decision support tools to help Conservancy project staff, as well as our external partners, develop the necessary plans, priorities and strategies to successfully adapt to uncertain changes in future climate. In the recently completed Southern Sierra Partnership's 2010 Climate-Adapted Conservation Plan for the Southern Sierra Nevada and Tehachapi Mountains, species and habitat forecasts shown here informed the development of a regional conservation design that explicitly incorporates long-term...
|

|
