Filters: Tags: Streamflow (X)
1,086 results (414ms)|
Filters
Date Range
Extensions Types
Contacts
Categories
Tag Types
|
The USGS Wyoming-Montana Water Science Center (WY–MT WSC) recently completed a report (Sando and McCarthy, 2018) documenting methods for peak-flow frequency analysis following implementation of the Bulletin 17C guidelines. The methods are used to provide estimates of peak-flow quantiles for 50-, 42.9-, 20-, 10-, 4-, 2-, 1-, 0.5-, and 0.2-percent annual exceedance probabilities (AEPs) for selected streamgages operated by the WY–MT WSC. In association with the report, this data release presents peak-flow frequency analyses for 14 selected streamgages in the Beaverhead River and Clark Fork Basins that were based on methods described by Sando and McCarthy (2018). First posted - March 26, 2018 (available from author)...
Categories: Data;
Tags: Montana,
annual exceedance probability,
hydrology,
peak-flow frequency,
streamflow
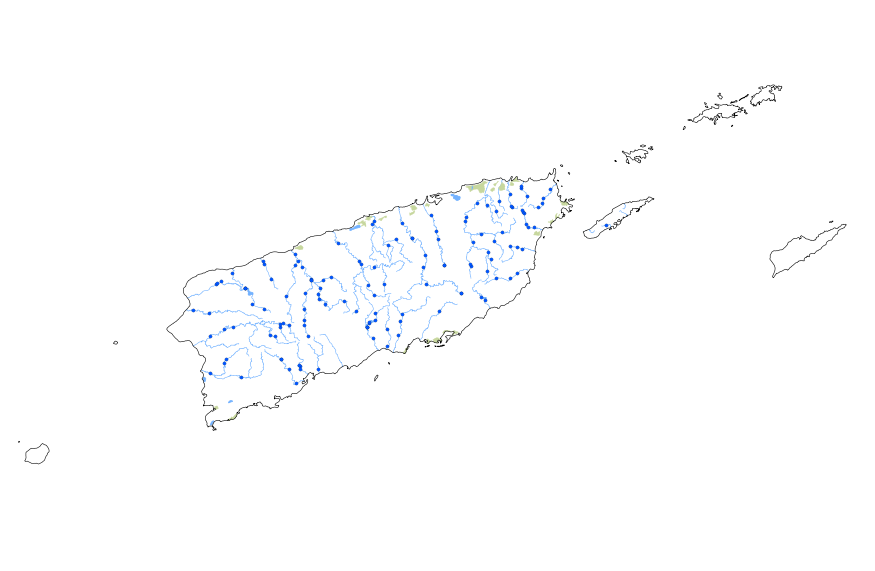
This geodatabase contains streams, waterbodies and wetlands, streamflow gaging stations, and coastlines for Puerto Rico and the U.S. Virgin Islands. The streams are incorporated into a geometric network. All feature classes are vertically integrated with each other and with 1:1,000,000-scale transportation and boundary data sets.
The dataset contain estimates of natural monthly streamflow for 135,118 stream segments in California, USA, from 1950 to 2012. These estimates were made using statistical models described in Carlisle and others, 2016, Open File Report 2016-1189. Segments are identified per the medium resolution National Hydrography Dataset (NHD), Version 1. The dataset also contains observed monthly streamflows and estimates of natural monthly streamflows for 894 USGS stream gages in California, USA.
Categories: Data;
Tags: California,
California,
National Hydrography Dataset,
National Water Quality Program,
Statistical model,
The upper Chattahoochee River Basin in northeast Georgia was modeled to produce seven example simulations of streamflow for demonstration of enhancements to the Precipitation Runoff Modeling System (PRMS). These data document the PRMS parameter files and input data files used in each of these simulations. Input files for the following simulations are included: 1) a baseline simulation of the existing model (includes HRU summary and basin variables output modules, and updates to depression storage), 2) a simulation using the dynamic parameters enhancement, 3) a simulation that generates an initial conditions file, 4) a simulation that uses a previously generated initial conditions file, 5) a simulation that uses...
This data release contains the input used and the output files interpreted in the publication "Refinement of a Regression-Based Method for Prediction of Flow-Duration Curves of Daily Streamflow in the Conterminous United States". This data release contains daily streamflow data for 1,378 streamgages in 19 study regions in the conterminous U.S. from October 1, 1980 through September 30, 2013 from mostly undisturbed watersheds. This data release also contains the empirical flow-duration curves (FDCs) derived from this daily streamflow data, presented as 27 quantiles ranging from 0.02 to 99.98 percent nonexceedance probabilities. Selected basin characteristics from the GAGES-II dataset (https://water.usgs.gov/lookup/getspatial?gagesII_Sept2011)...
7Q10 records and basin characteristics for 224 basins in South Carolina, Georgia, and Alabama (2015)
This data release provides the data and R scripts used for the 2018 publication titled "Improving predictions of hydrological low-flow indices in ungaged basins using machine learning", Environmental Modeling and Software, https://doi.org/10.1016/j.envsoft.2017.12.021.. There are two .csv files and 14 R-scripts included below. The lowflow_sc_ga_al_gagesII_2015.csv datafile contains the annual minimum seven-day mean streamflow with an annual exceedance probability of 90% (7Q10) for 224 basins in South Carolina, Georgia, and Alabama. The datafile also contains 231 basin characteristics from the Gages II dataset (https://water.usgs.gov/lookup/getspatial?gagesII_Sept2011). The "all_preds.csv" file contains the leave-one-out...
Categories: Data;
Types: Citation,
Map Service,
OGC WFS Layer,
OGC WMS Layer,
OGC WMS Service;
Tags: Alabama,
Georgia,
Hydrogeology,
South Carolina,
USGS Science Data Catalog (SDC),
Trends in nutrient fluxes and streamflow for selected tributaries in the Lake Erie watershed were calculated using monitoring data at 10 locations. Trends in flow-normalized nutrient fluxes were determined by applying a weighted regression approach called WRTDS (Weighted Regression on Time, Discharge, and Season). Site information and streamflow and water-quality records are contained in 3 zipped files named as follows: INFO (site information), Daily (daily streamflow records), and Sample (water-quality records). The INFO, Daily (flow), and Sample files contain the input data, by water-quality parameter and by site as .csv files, used to run trend analyses. These files were generated by the R (version 3.1.2) software...
NOTE: This data release has been deprecated. There is an updated version available here: https://doi.org/10.5066/P94EKLPP. The U.S. Geological Survey's (USGS) SPAtially Referenced Regression On Watershed attributes (SPARROW) model was used to aid in the interpretation of monitoring data and simulate streamflow and water-quality conditions in streams across the Southwestern Region of the Unites States. SPARROW is a hybrid empirical/process-based mass balance model that can be used to estimate the major sources and environmental factors that affect the long-term supply, transport, and fate of contaminants in streams. The spatially explicit model structure is defined by a river reach network coupled with contributing...
Pacific and Atlantic Ocean sea surface temperatures (SSTs) were used as predictors in a long lead-time streamflow forecast model in which the partial least squares regression (PLSR) technique was used with over 600 unimpaired streamflow stations in the continental United States. Initially, PLSR calibration (or test) models were developed for each station, using the previous spring-summer Pacific (or Atlantic) Ocean SSTs as predictors. Regions were identified in the Pacific Northwest, Upper Colorado River Basin, Midwest, and Atlantic states in which Pacific Ocean SSTs resulted in skillful forecasts. Atlantic Ocean SSTs resulted in significant regions being identified in the Pacific Northwest, Midwest, and Atlantic...
Categories: Publication;
Types: Citation,
Journal Citation;
Tags: Journal of Hydrologic Engineering,
forecasting,
least squares method,
ocean water,
streamflow,
This paper considers the risk of drought and develops drought scenarios for use in the study of severe sustained drought in the Southwestern United States. The focus is on the Colorado River Basin and regions to which Colorado River water is exported, especially southern California, which depends on water from the Colorado River. Drought scenarios are developed using estimates of unimpaired historic streamflow as well as reconstructions of streamflow based on tree ring widths. Drought scenarios in the Colorado River Basin are defined on the basis of annual flow at Lees Ferry. The risk, in terms of return period, of the drought scenarios developed, is assessed using stochastic models. Published in Journal of the...
Categories: Publication;
Types: Citation,
Journal Citation;
Tags: Colorado River,
Journal of the American Water Resources Association,
drought,
hydrology,
streamflow,

This collection of layers includes summary statistics from input and output data used for simulation of vegetation response to climate change in California. The historical data layers represent the 30 year period from 1961 to 1990. Future data layers represent each four 20 year periods: 2010-2029, 2030-2049, 2060-2079, and 2080-2099. The simulations were performed using MC1 dynamic global vegetation model (DGVM), source code revision 152. The model was parameterized and evaluated by the DGVM research group at the US Forest Service Pacific Northwest Research Station, with support from the Western Wildland Environmental Threat Assessment Center. The model was parameterized to maximize concordance with maps of potential...

This map represents the mean annual value of water contributed to the stream network, simulated by the model MC1 for the 30-year period 1971-2000. The data is from output variable STREAMFLOW in MC1 version B60. The data is in units comparable to rainfall, millimeters of water per year; values range from 5 to 895 mm yr-1. The mean value is 180 mm yr-1.

This dataset represents the average annual amount of water contributed to the stream network for each watershed, simulated by the model MC1 for the 30-year period 1971-2000. Simulated mean streamflow (stormflow + baseflow + runoff) was determined for each watershed. Watersheds represent 5th level (HUC5, 10-digit) hydrologic unit boundaries and were acquired from the Natural Resources Conservation Service. Streamflow units are comparable to rainfall - millimeters of water per year. Background: The dynamic global vegetation model MC1 (see Bachelet et al. 2001) was used to simulate vegetation dynamics, associated carbon and nitrogen cycle, water budget, and wild fire impacts for OR, WA, AZ and NM, for a project...
This dataset contains the selected regression models interpreted in the concurrent publication (Over and others, 2018). To each group of gaged basins in each region with one basin left out, a regression model selection procedure was applied to select the best set of basin characteristics for fitting regression models to each quantile in a set of up to three contiguous groups of FDC quantiles (called here a “flow regime”) for each of four or five binary methodology choices (thus 16 or 32 methodological combinations). This dataset provides the definitions of the selected flow regimes, the regression model parameters (intercepts and coefficients of the selected basin characteristics and their standard errors), variance...
The hydrologic response units (HRUs) available here are for seven applications of the Precipitation Runoff Modeling System (PRMS) in the Apalachicola-Chattahoochee-Flint River Basin (ACFB) by LaFontaine and others (2017). Geographic Information System (GIS) files for the HRUs in each of the seven model applications (whole ACFB, Chestatee River, Chipola River, Ichawaynochaway Creek, Potato Creek, Spring Creek, and Upper Chattahoochee River) are provided as shapefiles with attributes identifying the numbering convention used in the PRMS models of the ACFB.
Types: Citation;
Tags: Alabama,
Apalachicola River,
Chattahoochee River,
Chestatee River,
Chipola River,
The basis for these features is U.S. Geological Survey Scientific Investigations Report 2017-5024 Flood Inundation Mapping Data for Johnson Creek near Sycamore, Oregon. The domain of the HEC-RAS hydraulic model is a 12.9-mile reach of Johnson Creek from just upstream of SE 174th Avenue in Portland, Oregon, to its confluence with the Willamette River. Some of the hydraulics used in the model were taken from Federal Emergency Management Agency, 2010, Flood Insurance Study, City of Portland, Oregon, Multnomah, Clackamas, and Washington Counties, Volume 1 of 3, November 26, 2010. The Digital Elevation Model (DEM) utilized for the project was developed from lidar data flown in 2015 and provided by the Oregon Department...
Types: Citation;
Tags: Johnson Creek,
Portland, Oregon,
Willamette Valley,
digital elevation models,
floods,
The basis for these features is U.S. Geological Survey Scientific Investigations Report 2016-5105 Flood-inundation maps for the Peckman River in the Townships of Verona, Cedar Grove, and Little Falls, and the Borough of Woodland Park, New Jersey, 2014.Digital flood-inundation maps for an approximate 7.5-mile reach of the Peckman River in New Jersey, which extends from Verona Lake Dam in the Township of Verona downstream through the Township of Cedar Grove and the Township of Little Falls to the confluence with the Passaic River in the Borough of Woodland Park, were created by the U.S. Geological Survey (USGS) in cooperation with the New Jersey Department of Environmental Protection. Flood profiles were simulated...
Types: Map Service,
OGC WFS Layer,
OGC WMS Layer,
OGC WMS Service;
Tags: Little Falls,
New Jersey,
Passaic River,
Peckman River,
Verona,
This data release contains inputs for and outputs from hydrologic simulations of the southeastern U.S. using the Monthly Water Balance Model, the Precipitation Runoff Modeling System (PRMS), and statistically-based methods. These simulations were developed to provide estimates of water availability and statistics of streamflow for historical and potential future conditions for an area of approximately 1.16 million square miles. These model input and output data are intended to accompany a U.S. Geological Survey Scientific Investigations Report (LaFontaine and others, 2019); they include four types of data: 1) model input parameters, 2) model output statistics, 3) GIS files of the model hydrologic response units...
Spatially-referenced data used in the study "Rust, A.J., Saxe, S., McCray, J., Rhoades, C.C., Hogue, T.S., 2019. Evaluating the factors responsible for post-fire water quality response in forests of the western USA. Int. J. Wildland Fire.": Wildfires commonly increase nutrient, carbon, sediment, and metal inputs to streams yet the factors responsible for the type, magnitude and duration of water quality effects are poorly understood. Prior work by the current authors found increased nitrogen, phosphorus and cation exports were common the first 5 post-fire years from a synthesis of 159 wildfires across the western United States. In the current study, an analysis is undertaken to determine factors that best explain...
Categories: Data;
Tags: CONUS,
Continental United States,
Environmental Health,
Hydrogeology,
Land Use Change,
Detecting trends in biological attributes is central to many stream monitoring programs; however, understanding how natural variability in environmental factors affects trend results is not well understood. We evaluated the influence of antecedent streamflow and sample timing (covariates) on trend estimates for fish, invertebrate, and diatom taxa richness and biolgical condition from 2002 to 2012 at 51 sites distributed across the conterminous United States. This data release contains all of the input and output files necessary to reproduce the results presented and discussed in the associated journal article.
|

|
