Filters: Tags: Streamflow data (X) > Types: Citation (X)
7 results (50ms)|
Filters
Date Range
Types Contacts
Categories Tag Types Tag Schemes |
A comma separated values (csv) file that is a snapshot of the U.S. Geological Survey peak flow file on November 19, 2008. The file lists agency, station identification, water year, peak date, peak values, peak qualification codes, gage height values, gage height qualification codes and year of last peak for all stream gaging stations for which peak streamflow has been recorded.
Categories: Data;
Types: Citation;
Tags: Datasets,
Floods,
Stream discharge,
Streamflow data,
United States
A comma separated values (csv) file that is a snapshot of percent difference between November 19, 2008 and November 14, 2016 peak streamflow. The file lists station identification, water year, original (2008) peak Q, current (2016) peak Q and percent difference calculated per water year. The percent difference was calculated as the absolute value of [(current peak Q - original peak Q)/(original peak Q) x 100], where current peak Q is the 2016 peak and the original peak Q is the 2008 peak. When an original peak Q value is 0, the resultant percent difference calculation is undefined because of division by 0. In these cases, the percent difference field is populated with NA. Those entries are included in the data file...
Categories: Data;
Types: Citation;
Tags: Datasets,
Floods,
Stream discharge,
Streamflow data,
United States

The High Resolution National Hydrography Dataset Plus (NHDPlus HR) is an integrated datset of geospatial data layers, including the most current National Hydrography Dataset (NHD), the 10-meter 3D Elevation Program Digital Elevation Model (3DEP DEM), and the National Watershed Boundary Dataset (WBD). The NHDPlus HR combines the NHD, 3DEP DEMs, and WBD to create a stream network with linear referencing, feature naming, "value added attributes" (VAAs), elevation-derived catchments, and other features for hydrologic data analysis. The stream network with linear referencing is a system of data relationships applied to hydrographic systems so that one stream reach "flows" into another and "events" can be tied to and...
Types: Citation;
Tags: Administrative watershed units,
Area of Complex Channels,
Area to be submerged,
Basin,
Bay/Inlet,
A comma separated values (csv) file that is a snapshot of the U.S. Geological Survey peak flow file on November 14, 2016. The file lists agency, station identification, water year, peak date, peak values, peak qualification codes, gage height values, gage height qualification codes, and year of last peak for all stream gaging stations for which peak streamflow has been recorded.
Categories: Data;
Types: Citation;
Tags: Datasets,
Floods,
Stream discharge,
Streamflow data,
United States
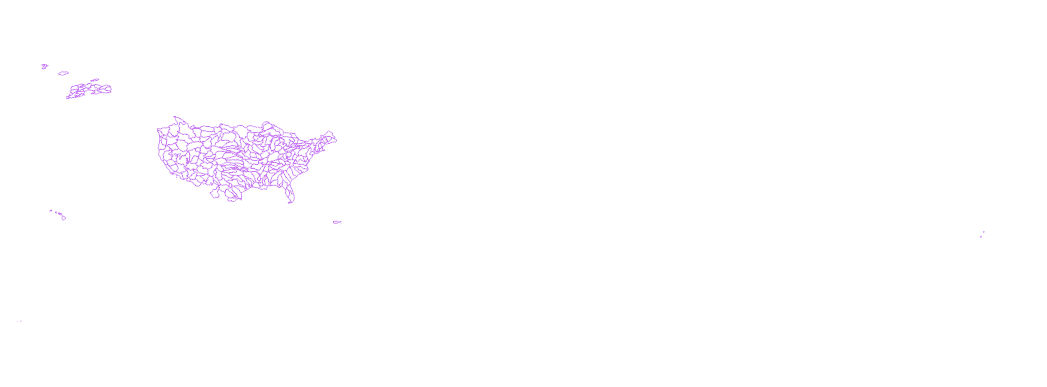
These data provide a public summary of the changes made to the U.S. Geological Survey peak-flow file since formal Nation-wide checking began in 2008. Coverage includes peak-flow sites in the United States and territories.
Types: Citation,
Map Service,
OGC WFS Layer,
OGC WMS Layer,
OGC WMS Service;
Tags: Datasets,
Floods,
Stream discharge,
Streamflow data,
U.S. Geological Survey,
The dataset contains daily values of hydrologic and physical parameters. These daily values were calculated from continuous (15-minute) data collected from continuous water quality monitors (CWQMs) installed at five gaged sites within the Little Blue River watershed in Independence, Missouri. The data were used as input to regression models to predict Escherichia coli (E. coli) loads. Any data estimation was performed according to procedures described in the WEFTEC 2017 conference proceedings paper "Evaluation of Modeled Bacteria Loads Along an Impaired Stream Reach Receiving Discharge from a Municipal Separate Storm Sewer System in Independence, Mo." Periods of missing daily values were due to equipment malfunction,...
Categories: Data;
Types: Citation;
Tags: East Fork Little Blue River,
Independence, Missouri,
Little Blue River,
dissolved oxygen,
precipitation,
This U.S. Geological Survey (USGS) data release includes Escherichia coli (E. coli) data and also continuous hydrologic and physical parameters at USGS streamgage sites on the Little Blue River and its tributaries in Independence, MO, during the 2010-2016 recreation seasons. The U.S. Geological Survey, in coordination with the City of Independence, collected the data for use in regression models to evaluation E. coli loads in the Little Blue River and its tributaries within the boundaries of the City of Independence. Further information on the methods and the results of the data collection and regression models can be found in the conference proceedings paper cited below. These data support the following publication:...
Categories: Data;
Types: Citation;
Tags: East Fork Little Blue River,
Independence, Missouri,
Little Blue River,
USGS Science Data Catalog (SDC),
Water Quality,
|

|