Filters: Tags: Suffolk County (X)
264 results (45ms)|
Filters
Date Range
Extensions Types Contacts
Categories Tag Types
|
This U.S. Geological Survey data release provides surface-water quality, streamflow, and groundwater-elevation data collected within the Central Pine Barrens (CPB) Region of Suffolk County, New York. The data were collected in cooperation with the Central Pine Barrens Commission and the Town of Brookhaven as part of a five-year comprehensive water-resources monitoring program. Water quality and quality-assurance data from seven sites on two rivers (Carmans River- 5 sites and Peconic River - 2 sites) in the CPB are included. Carmans River sites were sampled four times throughout the year (fall, winter, spring, and summer) and Peconic River sites were sampled twice throughout the year (fall and spring). Water-quality...
Categories: Data,
Data Release - Revised;
Types: Downloadable,
Map Service,
OGC WFS Layer,
OGC WMS Layer,
Shapefile;
Tags: Ambient Monitoring,
Carmans River,
Central Pine Barrens,
Contaminants, Emerging,
Contaminants, Natural,
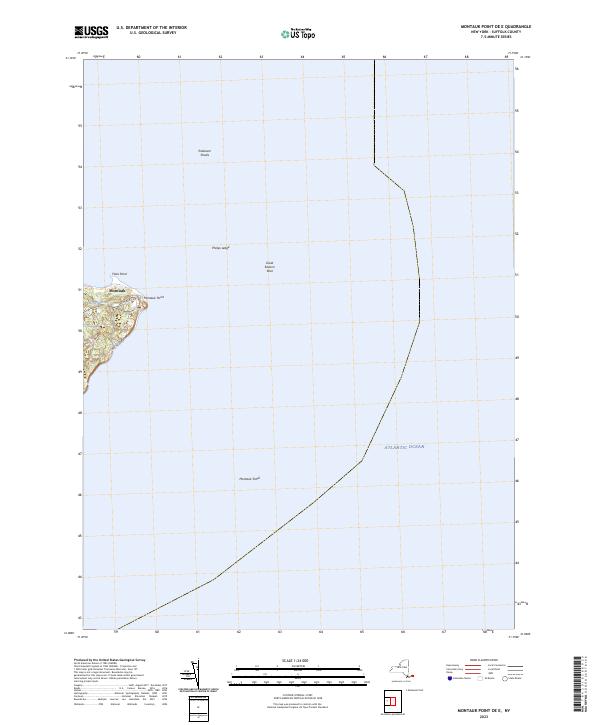
Layered geospatial PDF 7.5 Minute Quadrangle Map. Layers of geospatial data include orthoimagery, roads, grids, geographic names, elevation contours, hydrography, and other selected map features. This map is derived from GIS (geospatial information system) data. It represents a repackaging of GIS data in traditional map form, not creation of new information. The geospatial data in this map are from selected National Map data holdings and other government sources.
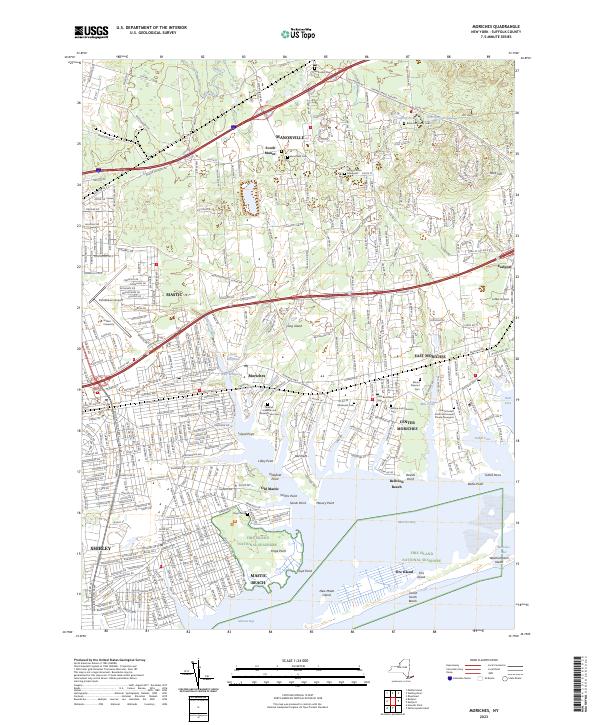
Layered geospatial PDF 7.5 Minute Quadrangle Map. Layers of geospatial data include orthoimagery, roads, grids, geographic names, elevation contours, hydrography, and other selected map features. This map is derived from GIS (geospatial information system) data. It represents a repackaging of GIS data in traditional map form, not creation of new information. The geospatial data in this map are from selected National Map data holdings and other government sources.
Layered geospatial PDF 7.5 Minute Quadrangle Map. Layers of geospatial data include orthoimagery, roads, grids, geographic names, elevation contours, hydrography, and other selected map features. This map is derived from GIS (geospatial information system) data. It represents a repackaging of GIS data in traditional map form, not creation of new information. The geospatial data in this map are from selected National Map data holdings and other government sources.
Layered geospatial PDF 7.5 Minute Quadrangle Map. Layers of geospatial data include orthoimagery, roads, grids, geographic names, elevation contours, hydrography, and other selected map features. This map is derived from GIS (geospatial information system) data. It represents a repackaging of GIS data in traditional map form, not creation of new information. The geospatial data in this map are from selected National Map data holdings and other government sources.
Layered geospatial PDF 7.5 Minute Quadrangle Map. Layers of geospatial data include orthoimagery, roads, grids, geographic names, elevation contours, hydrography, and other selected map features. This map is derived from GIS (geospatial information system) data. It represents a repackaging of GIS data in traditional map form, not creation of new information. The geospatial data in this map are from selected National Map data holdings and other government sources.
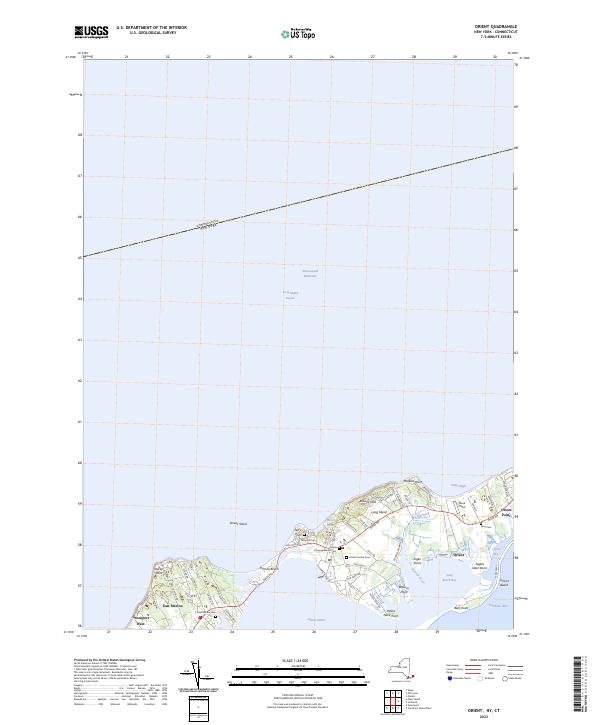
Layered geospatial PDF 7.5 Minute Quadrangle Map. Layers of geospatial data include orthoimagery, roads, grids, geographic names, elevation contours, hydrography, and other selected map features. This map is derived from GIS (geospatial information system) data. It represents a repackaging of GIS data in traditional map form, not creation of new information. The geospatial data in this map are from selected National Map data holdings and other government sources.
This data release contains coastal wetland synthesis products for the geographic region of Hudson Valley and New York City, New York. Metrics for resiliency, including unvegetated to vegetated ratio (UVVR), marsh elevation, and mean tidal range, are calculated for smaller units delineated from a Digital Elevation Model, providing the spatial variability of physical factors that influence wetland health. Through scientific efforts initiated with the Hurricane Sandy Science Plan, the U.S. Geological Survey has been expanding national assessment of coastal change hazards and forecast products to coastal wetlands with the intent of providing Federal, State, and local managers with tools to estimate the vulnerability...
Categories: Data;
Types: Downloadable,
Map Service,
OGC WFS Layer,
OGC WMS Layer,
Shapefile;
Tags: Atlantic Ocean,
Long Island Sound,
Nassau County,
New York,
Suffolk County,
Elevation distribution in the Fire Island National Seashore and Central Great South Bay salt marsh complex is given in terms of mean elevation of conceptual marsh units defined by Defne and Ganju (2018). The elevation data is based on the 1-meter resolution Coastal National Elevation Database (CoNED). Through scientific efforts initiated with the Hurricane Sandy Science Plan, the U.S. Geological Survey has been expanding national assessment of coastal change hazards and forecast products to coastal wetlands, including the Fire Island National Seashore and Central Great South Bay salt marshes, with the intent of providing Federal, State, and local managers with tools to estimate the vulnerability and ecosystem service...
Categories: Data;
Types: Downloadable,
Map Service,
OGC WFS Layer,
OGC WMS Layer,
Shapefile;
Tags: Atlantic Ocean,
Bellport Bay,
Ecology,
Fire Island National Seashore,
Geography,
Layered geospatial PDF 7.5 Minute Quadrangle Map. Layers of geospatial data include orthoimagery, roads, grids, geographic names, elevation contours, hydrography, and other selected map features. This map is derived from GIS (geospatial information system) data. It represents a repackaging of GIS data in traditional map form, not creation of new information. The geospatial data in this map are from selected National Map data holdings and other government sources.
Layered geospatial PDF 7.5 Minute Quadrangle Map. Layers of geospatial data include orthoimagery, roads, grids, geographic names, elevation contours, hydrography, and other selected map features. This map is derived from GIS (geospatial information system) data. It represents a repackaging of GIS data in traditional map form, not creation of new information. The geospatial data in this map are from selected National Map data holdings and other government sources.
Layered geospatial PDF 7.5 Minute Quadrangle Map. Layers of geospatial data include orthoimagery, roads, grids, geographic names, elevation contours, hydrography, and other selected map features. This map is derived from GIS (geospatial information system) data. It represents a repackaging of GIS data in traditional map form, not creation of new information. The geospatial data in this map are from selected National Map data holdings and other government sources.
The U.S. Geological Survey (USGS) is providing online maps of water-table and potentiometric-surface altitude in the upper glacial, Magothy, Jameco, Lloyd, and North Shore aquifers on Long Island, New York, April–May 2016. Also provided is a depth-to-water map for Long Island, New York, April–May 2016. The USGS makes these maps and geospatial data available as REST Open Map Services (as well as HTTP, JSON, KML, and shapefile), so end-users can consume them on mobile and web clients. A companion report, U.S. Geological Survey Scientific Investigations Map 3398 (Como and others, 2018; https://doi.org/10.3133/sim3398) further describes data collection and map preparation and presents 68x22 in. Portable Document...
Categories: Data;
Types: ArcGIS REST Map Service,
ArcGIS Service Definition,
Citation,
Downloadable,
Map Service;
Tags: Contours,
Groundwater,
Hydrology,
Jameco Aquifer,
Levels,
The U.S. Geological Survey (USGS) is providing an online map of potentiometric-surface altitude contours in the Magothy and Jameco aquifers on Long Island, New York, April-May 2013. USGS serves this map and geospatial data as a REST Open Map Service (as well as HTTP, JSON, KML, and shapefile), so end-users can use the map and data on mobile and web clients. A companion report, U.S. Geological Survey Scientific Investigations Map 3326 (Como and others, 2015; http://dx.doi.org/10.3133/sim3326) further describes data collection and map preparation and presents 68x22 in. PDF versions, 4 sheets, scale 1:125,000. This polyline shapefile consists of digital contours that represent the potentiometric-surface...
Categories: Data,
Publication;
Types: ArcGIS REST Map Service,
ArcGIS Service Definition,
Citation,
Downloadable,
Map Service;
Tags: Contours,
Contours,
Geospatial Applications,
Groundwater,
Groundwater,

Layers of geospatial data include contours, boundaries, land cover, hydrography, roads, transportation, geographic names, structures, and other selected map features.
Types: Citation;
Tags: 7.5 x 7.5 minute,
7_5_Min,
Combined Vector,
Combined Vector,
Combined Vector,
Layers of geospatial data include contours, boundaries, land cover, hydrography, roads, transportation, geographic names, structures, and other selected map features.
Layers of geospatial data include contours, boundaries, land cover, hydrography, roads, transportation, geographic names, structures, and other selected map features.
Types: Citation;
Tags: 7.5 x 7.5 minute,
7_5_Min,
Combined Vector,
Combined Vector,
Combined Vector,
Layers of geospatial data include contours, boundaries, land cover, hydrography, roads, transportation, geographic names, structures, and other selected map features.
Types: Citation;
Tags: 7.5 x 7.5 minute,
7_5_Min,
Combined Vector,
Combined Vector,
Combined Vector,
Layers of geospatial data include contours, boundaries, land cover, hydrography, roads, transportation, geographic names, structures, and other selected map features.
Types: Citation;
Tags: 7.5 x 7.5 minute,
7_5_Min,
Combined Vector,
Combined Vector,
Combined Vector,
Layers of geospatial data include contours, boundaries, land cover, hydrography, roads, transportation, geographic names, structures, and other selected map features.
Types: Citation;
Tags: 7.5 x 7.5 minute,
7_5_Min,
Combined Vector,
Combined Vector,
Combined Vector,
|

|
