Filters: Tags: The Nature Conservancy (X)
183 results (38ms)|
Filters
Date Range
Extensions Types
Contacts
Categories Tag Types
|
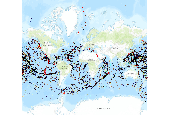
Seamounts and vents map citation: Kitchingman and Lai 2004, Ramirez-Llodra and Baker 2006. Map data source: Kitchingman, A. and S. Lai. 2004. âInferences on potential seamount locations from mid-resolution bathymetric data.â In: Morato T, Pauly D (eds) Seamounts: Biodiversity and Fisheries. Fisheries Centre, University of British Colombia, Vancouver, Canada, pp 7-12 Ramirez-Llodra, E. and M.C. Baker. 2006. Data on the location of hydrothermal vents. Biogeography of Chemosynthetic Ecosystems (ChEss) Project (www.noc.soton.ac.uk/chess). Map Technical Notes Locations of seamounts are from (Kitchingman and Lai 2004) and were developed from a global GIS based analysis, which identifies a total of 14,000 seamounts....

Number of freshwater fish species, by freshwater ecoregion. The map of freshwater fish species richness—the number of species present in each ecoregion—was generated from a variety of sources by Abell et al. (2008). Only species using freshwater for at least a portion of their life cycles, as identified using the habitat assignments in FishBase, are included. For the United States, NatureServe provided presence/absence data for individual species, coded to eight-digit hydrologic unit codes (HUCs); these HUC occurrences were then translated into ecoregions, and the data were manually cleaned of erroneous occurrences derived from species introductions and problematic records. For all other ecoregions, species lists...

Human population density in 2000, by terrestrial ecoregion. We summarized human population density by ecoregion using the Gridded Population of the World database and projections for 2015 (CIESIN et al. 2005). The mean for each ecoregion was extracted using a zonal statistics algorithm. These data were derived by The Nature Conservancy, and were displayed in a map published in The Atlas of Global Conservation (Hoekstra et al., University of California Press, 2010). More information at http://nature.org/atlas. Data derived from: Center for International Earth Science Information Network (CIESIN), Columbia University; and Centro Internacional de Agricultura Tropical (CIAT). 2005. Gridded Population of the World...

Percent of ecoregion area covered with desert and aridland habitat. We derived the aridlands map by first developing a raster-based mask of arid climates from the Köppen-Geiger climate classification (Kottek et al. 2006) using ArcInfo GIS software. We applied the mask to the GLC 2000 global land cover, and then extracted sparse vegetation classes. For example, pockets of forested land occurring within Köppen-Geiger arid climate regions were excluded. Areas of human habitation and infrastructure were also removed from the map, leaving only natural desert lands. Finally, we applied a zonal sum procedure to the raster map to calculate the percentage of arid land per ecoregion. These data were derived by The Nature...

Number of migratory fish species, by freshwater ecoregion. We derived the map of long-distance migrant (LDM) fish—the number of LDM species per ecoregion—from published literature, online databases (NatureServe), and expert inquiries. Potadromous, anadromous, amphidromous, and catadromous fish species were judged to be LDMs if they made regular journeys (i.e., for breeding, dispersal, feeding) of at least a hundred kilometers or more in freshwater. These species were then assigned to ecoregions based on the fish species lists database from Abell et al. (2008). Although we used many resources, two key data sources for the map were the following: Carolsfeld, J., B. Harvey, C. Ross, and A. Baer, eds. 2003. Migratory...

Percent of ecoregion area covered with forest habitat. We derived the forest map from forest and woodland classes of the Global Land Cover 2000 data set (JRC 2003) with areas of human habitation and infrastructure from the Global Rural-Urban Mapping Project database (CIESIN et al. 2004) removed. We applied a zonal sum procedure to those data to show the amount of forest by ecoregion. These data were derived by The Nature Conservancy, and were displayed in a map published in The Atlas of Global Conservation (Hoekstra et al., University of California Press, 2010). More information at http://nature.org/atlas. Data derived from: Center for International Earth Science Information Network (CIESIN), International Food...
Number of globally threatened marine mammal species, by marine ecoregion. Using the online IUCN resource, the threatened species for each ecoregion were filtered for marine species only. Threatened species refer to those listed by IUCN Red List as Vulnerable, Endangered, or Critically Endangered (www.redlist.org). We downloaded the digital GIS data and summarized it by marine ecoregion to result in the number of threatened species per marine ecoregion. These data were derived by The Nature Conservancy, and were displayed in a map published in The Atlas of Global Conservation (Hoekstra et al., University of California Press, 2010). More information at http://nature.org/atlas. Data derived from: International Union...

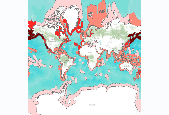
Change in nitrogen flow to the coast since pre-industrial times, by marine ecoregion. The map shows the estimated change in coastal discharge of dissolved inorganic nitrogen (DIN) between preindustrial and contemporary times by marine ecoregion. We calculated this change using data from Green et al. (2005), which was developed using land surface runoff models that included agriculture, livestock, human sewage, and atmospheric deposition sources of DIN. The original spatial data set assigned discharge values to coastal pixels, and we summed the value of pixels within each ecoregion for each time period. We then calculated ecoregional values by subtracting preindustrial sums from contemporary values. These data...

Percent land area formally protected, by terrestrial ecoregion. We derived estimates of protected area coverage from the World Database of Protected Areas (WDPA, UNEP/IUCN 2007) with supplements for the United States (CBI 2006) and Australia (CAPAD 2006). The WDPA is the most comprehensive global catalog of protected areas and includes data about their sizes, locations, and IUCN classifications of management designation. The WDPA was assembled by a broad alliance of organizations that aimed to maintain a freely available, accurate, and current database that is accepted as a global standard by all stakeholders. The distribution of all protected areas was mapped in a Geographic Information System and then summarized...

Accessibility of natural habitats to humans, by terrestrial ecoregion. The human accessibility map provides an index of the level of effort it would take for a human on foot to access any given square kilometer of nonconverted land from existing infrastructure. We calculated human accessibility from a one-square-kilometer spatial grid of the terrestrial world consisting of a cost surface where the value of each cell was derived from topographic slope, vegetation type, and vegetation density. We developed a second matching spatial grid of infrastructure, depicting roads, railroads, navigable rivers, cities, and towns. Then we calculated a least cost path from each noninfrastructure grid cell to infrastructure grid...

Proportion of coral bleaching events that were high impact, by marine ecoregion. Data on coral bleaching is derived from ReefBase and represents bleaching from a single year (1998). This was the worst bleaching event on record, linked to an El Niño year. It was also very well monitored, partly because of its unprecedented nature. Bleaching has remained widespread since that time in locations around the world. The data was generously provided by Jamie Oliver from a subset that was prepared for another publication (Oliver et al. 2008), and we have only made minor corrections to errors for the Seychelles in this data set. Bleaching reports in ReefBase were derived from a broad range of sources, but each has been assigned...
This collection of photographs was taken by Dale Turner of the Nature Conservancy, with support from Eloise Kendy and ....
|

|
