Filters: Tags: Thurston County (X)
137 results (66ms)|
Filters
Date Range
Extensions Types
Contacts
Categories Tag Types Tag Schemes |
Layered geospatial PDF 7.5 Minute Quadrangle Map. Layers of geospatial data include orthoimagery, roads, grids, geographic names, elevation contours, hydrography, and other selected map features. This map is derived from GIS (geospatial information system) data. It represents a repackaging of GIS data in traditional map form, not creation of new information. The geospatial data in this map are from selected National Map data holdings and other government sources.
Layered geospatial PDF 7.5 Minute Quadrangle Map. Layers of geospatial data include orthoimagery, roads, grids, geographic names, elevation contours, hydrography, and other selected map features. This map is derived from GIS (geospatial information system) data. It represents a repackaging of GIS data in traditional map form, not creation of new information. The geospatial data in this map are from selected National Map data holdings and other government sources.
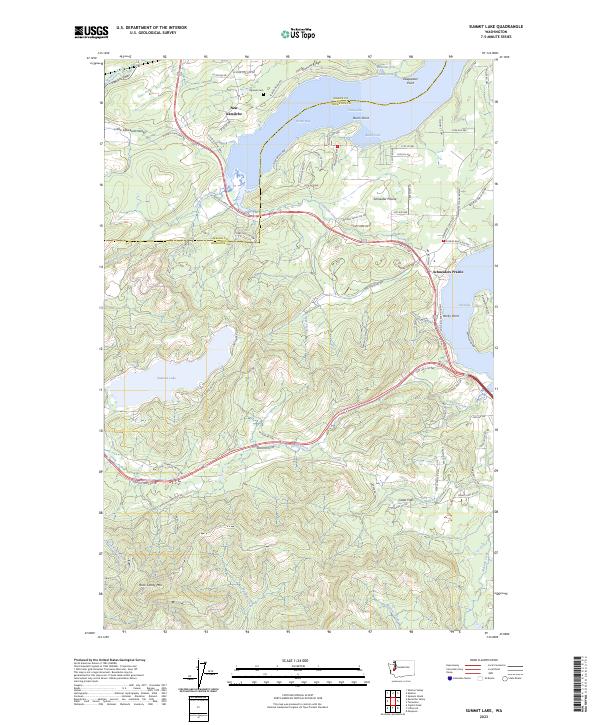
Layered geospatial PDF 7.5 Minute Quadrangle Map. Layers of geospatial data include orthoimagery, roads, grids, geographic names, elevation contours, hydrography, and other selected map features. This map is derived from GIS (geospatial information system) data. It represents a repackaging of GIS data in traditional map form, not creation of new information. The geospatial data in this map are from selected National Map data holdings and other government sources.
An upward-looking acoustic Doppler velocity meter (ADVM; Sontek XR, 1.5 MHz) was deployed in McAllister Creek at site MC2 (N 47° 05’ 43”/W 122° 43’ 38”) and continuously recorded water velocity, temperature and water level at 5-minute intervals from September 26, 2016 to October 14, 2016 (18 days), and at 15-minute intervals from December 2, 2016 to May 25, 2017 (174 days) except for the period of March 6 – 11, 2017 when the sensor was removed for maintenance and battery replacement. The site is tidally influenced and located approximately 0.7 km upstream from the mouth of McAllister Creek. The measurement averaging interval for the ADVM was 60 s. The blanking distance was set at 0.5 m and the cell end was set at...
Categories: Data;
Types: Downloadable,
Map Service,
OGC WFS Layer,
OGC WMS Layer,
Shapefile;
Tags: Billy Frank Jr. Nisqually National Wildlife Refuge,
Hydrodynamics,
Sediment,
Thurston County,
salinity,
Layers of geospatial data include contours, boundaries, land cover, hydrography, roads, transportation, geographic names, structures, and other selected map features.
Types: Citation;
Tags: 7.5 x 7.5 minute,
7.5 x 7.5 minute,
Combined Vector,
Combined Vector,
Combined Vector,
Layered geospatial PDF 7.5 Minute Quadrangle Map. Layers of geospatial data include orthoimagery, roads, grids, geographic names, elevation contours, hydrography, and other selected map features. This map is derived from GIS (geospatial information system) data. It represents a repackaging of GIS data in traditional map form, not creation of new information. The geospatial data in this map are from selected National Map data holdings and other government sources.
Layered geospatial PDF 7.5 Minute Quadrangle Map. Layers of geospatial data include orthoimagery, roads, grids, geographic names, elevation contours, hydrography, and other selected map features. This map is derived from GIS (geospatial information system) data. It represents a repackaging of GIS data in traditional map form, not creation of new information. The geospatial data in this map are from selected National Map data holdings and other government sources.
Layered geospatial PDF 7.5 Minute Quadrangle Map. Layers of geospatial data include orthoimagery, roads, grids, geographic names, elevation contours, hydrography, and other selected map features. This map is derived from GIS (geospatial information system) data. It represents a repackaging of GIS data in traditional map form, not creation of new information. The geospatial data in this map are from selected National Map data holdings and other government sources.
Layered geospatial PDF 7.5 Minute Quadrangle Map. Layers of geospatial data include orthoimagery, roads, grids, geographic names, elevation contours, hydrography, and other selected map features. This map is derived from GIS (geospatial information system) data. It represents a repackaging of GIS data in traditional map form, not creation of new information. The geospatial data in this map are from selected National Map data holdings and other government sources.
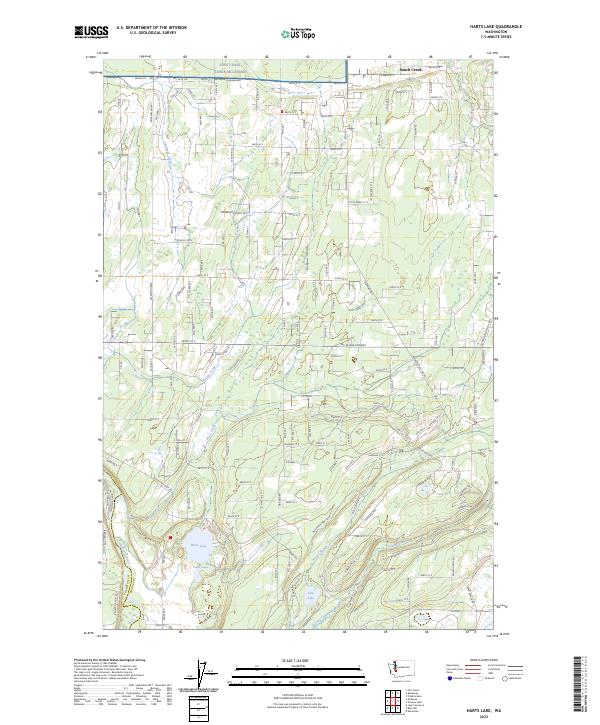
Layered geospatial PDF 7.5 Minute Quadrangle Map. Layers of geospatial data include orthoimagery, roads, grids, geographic names, elevation contours, hydrography, and other selected map features. This map is derived from GIS (geospatial information system) data. It represents a repackaging of GIS data in traditional map form, not creation of new information. The geospatial data in this map are from selected National Map data holdings and other government sources.
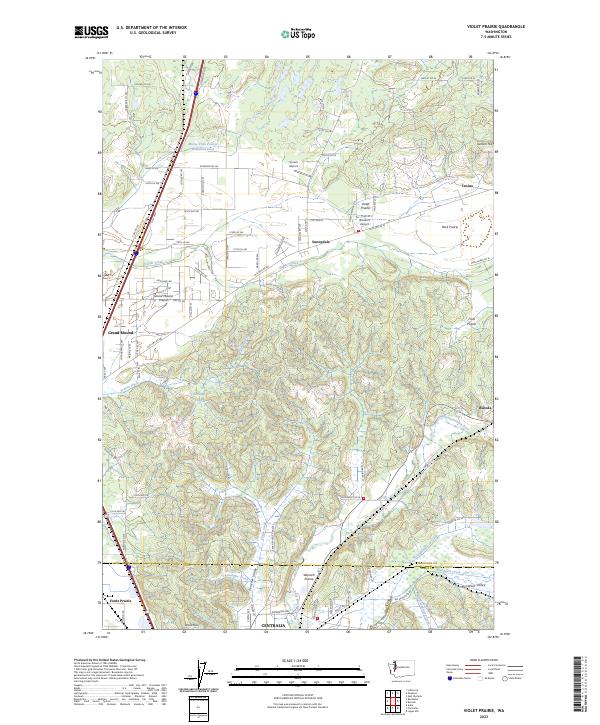
Layered geospatial PDF 7.5 Minute Quadrangle Map. Layers of geospatial data include orthoimagery, roads, grids, geographic names, elevation contours, hydrography, and other selected map features. This map is derived from GIS (geospatial information system) data. It represents a repackaging of GIS data in traditional map form, not creation of new information. The geospatial data in this map are from selected National Map data holdings and other government sources.
Layered geospatial PDF 7.5 Minute Quadrangle Map. Layers of geospatial data include orthoimagery, roads, grids, geographic names, elevation contours, hydrography, and other selected map features. This map is derived from GIS (geospatial information system) data. It represents a repackaging of GIS data in traditional map form, not creation of new information. The geospatial data in this map are from selected National Map data holdings and other government sources.
Layered geospatial PDF 7.5 Minute Quadrangle Map. Layers of geospatial data include orthoimagery, roads, grids, geographic names, elevation contours, hydrography, and other selected map features. This map is derived from GIS (geospatial information system) data. It represents a repackaging of GIS data in traditional map form, not creation of new information. The geospatial data in this map are from selected National Map data holdings and other government sources.
Layers of geospatial data include contours, boundaries, land cover, hydrography, roads, transportation, geographic names, structures, and other selected map features.
An upward-looking acoustic Doppler velocity meter (ADVM, SonTek SW, 3.0 MHz) located in a tidal channel of the Nisqually River Delta at site D2 (N 47d 05’ 37.2”/W 122d 42’ 56.4”) measured water level and current velocity at 15-minute intervals from February 16 to July 20, 2017 (104 of 154 days, accounting for missing periods). This site is in a tidal channel at a levee breach where flow is tidally influenced. The water depth of the sensor ranged from 0.04 to 4.63 m and may have been lower during periods of extreme low tide. The elevation (NAVD88) of the ADVM sensor was surveyed by RTN-GPS. The offset to convert all water depth time-series data to water surface elevation (NAVD88) is 0.06 meters. Instrument temperature...
Categories: Data;
Types: Downloadable,
Map Service,
OGC WFS Layer,
OGC WMS Layer,
Shapefile;
Tags: Billy Frank Jr. Nisqually National Wildlife Refuge,
Hydrodynamics,
Sediment,
Thurston County,
salinity,
A vented water-level logger was installed at site MC1 (N 47° 05’ 12.2”/W 122° 43’ 36.8”) and continuously measured water depth and temperature at 15-minute intervals from Nov 22, 2016 to Sept 6, 2017 (288 days). This site is tidally influenced and located 1.12 km from the mouth of McAllister Creek. Elevation (NAVD88) of the water surface above the sensor was surveyed by RTN-GPS. The offset to convert all water depth time-series data to water surface elevation (NAVD88) is -1.052 m. Water depth ranged from 0.69 to 4.88 m. Temperature ranged from 2.8 to 22.5 degrees C.
Categories: Data;
Types: Downloadable,
Map Service,
OGC WFS Layer,
OGC WMS Layer,
OGC WMS Service,
Shapefile;
Tags: Billy Frank Jr. Nisqually National Wildlife Refuge,
Hydrodynamics,
Sediment,
Thurston County,
salinity,
Layers of geospatial data include contours, boundaries, land cover, hydrography, roads, transportation, geographic names, structures, and other selected map features.
Layered geospatial PDF 7.5 Minute Quadrangle Map. Layers of geospatial data include orthoimagery, roads, grids, geographic names, elevation contours, hydrography, and other selected map features. This map is derived from GIS (geospatial information system) data. It represents a repackaging of GIS data in traditional map form, not creation of new information. The geospatial data in this map are from selected National Map data holdings and other government sources.
Layered geospatial PDF 7.5 Minute Quadrangle Map. Layers of geospatial data include orthoimagery, roads, grids, geographic names, elevation contours, hydrography, and other selected map features. This map is derived from GIS (geospatial information system) data. It represents a repackaging of GIS data in traditional map form, not creation of new information. The geospatial data in this map are from selected National Map data holdings and other government sources.
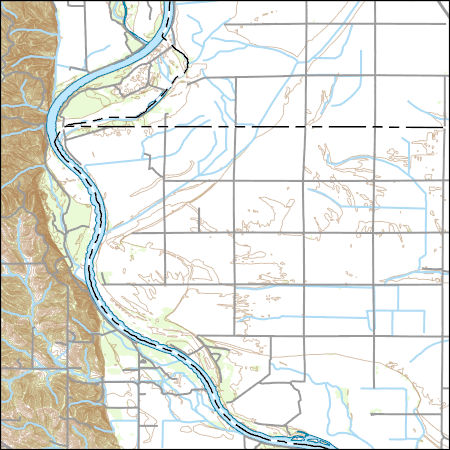
To support the modeling of storm-induced flooding, the USGS Coastal National Elevation Database (CoNED) Applications Project has created an integrated 1-meter topobathymetric digital elevation model (TBDEM) for Puget Sound. Puget Sound is located along the northwestern coast of Washington and is part of the Salish Sea. Puget Sound is the third largest estuary in the United States. High-resolution coastal elevation data is required to identify flood, storm, and sea-level rise inundation hazard zones and other earth science applications, such as the development of sediment transport and storm surge models. The new TBDEM consists of the best available multi-source topographic and bathymetric elevation data for Puget...
|

|
