Filters: Tags: Ulster County (X)
107 results (60ms)|
Filters
Date Range
Extensions Types Contacts
Categories Tag Types
|
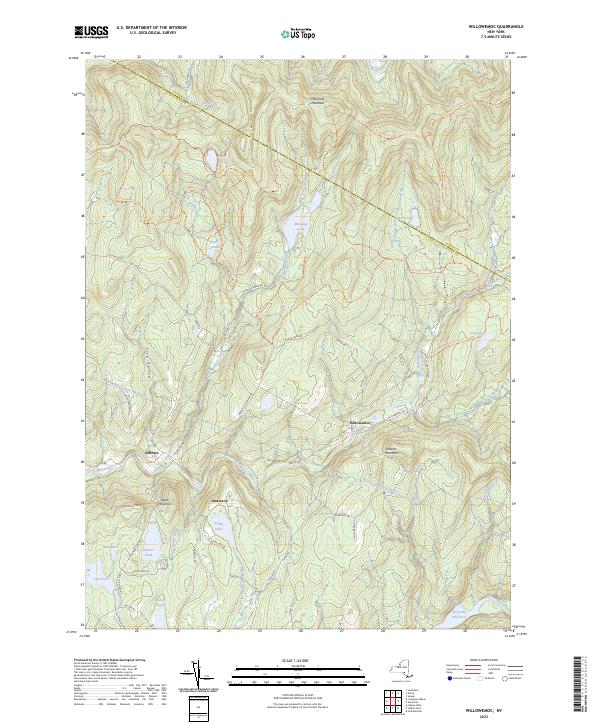
Layered geospatial PDF 7.5 Minute Quadrangle Map. Layers of geospatial data include orthoimagery, roads, grids, geographic names, elevation contours, hydrography, and other selected map features. This map is derived from GIS (geospatial information system) data. It represents a repackaging of GIS data in traditional map form, not creation of new information. The geospatial data in this map are from selected National Map data holdings and other government sources.
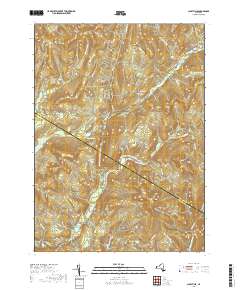
Layered geospatial PDF 7.5 Minute Quadrangle Map. Layers of geospatial data include orthoimagery, roads, grids, geographic names, elevation contours, hydrography, and other selected map features. This map is derived from GIS (geospatial information system) data. It represents a repackaging of GIS data in traditional map form, not creation of new information. The geospatial data in this map are from selected National Map data holdings and other government sources.
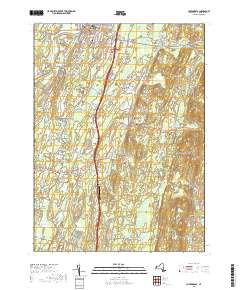
Layered geospatial PDF 7.5 Minute Quadrangle Map. Layers of geospatial data include orthoimagery, roads, grids, geographic names, elevation contours, hydrography, and other selected map features. This map is derived from GIS (geospatial information system) data. It represents a repackaging of GIS data in traditional map form, not creation of new information. The geospatial data in this map are from selected National Map data holdings and other government sources.
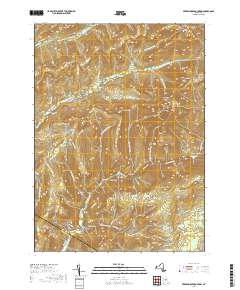
Layered geospatial PDF 7.5 Minute Quadrangle Map. Layers of geospatial data include orthoimagery, roads, grids, geographic names, elevation contours, hydrography, and other selected map features. This map is derived from GIS (geospatial information system) data. It represents a repackaging of GIS data in traditional map form, not creation of new information. The geospatial data in this map are from selected National Map data holdings and other government sources.
From 2013 to 2015, bathymetric surveys of New York City’s six West of Hudson reservoirs (Ashokan, Cannonsville, Neversink, Pepacton, Rondout, and Schoharie) were performed to provide updated capacity tables and bathymetric maps. Depths were surveyed with a single-beam echo sounder and real-time kinematic global positioning system (RTK-GPS) along planned transects at predetermined intervals for each reservoir. A separate set of echo sounder data was collected along transects at oblique angles to the main transects for accuracy assessment. Field survey data was combined with water-surface elevations in a geographic information system to create three-dimensional surfaces representing reservoir-bed elevations in the...
Categories: Data;
Types: Citation,
Downloadable,
GeoTIFF,
Map Service,
Raster;
Tags: Ashokan Reservoir,
GPS measurement,
Ulster County,
bathymetry,
single-beam echo sounder
From 2013 to 2015, bathymetric surveys of New York City’s six West of Hudson reservoirs (Ashokan, Cannonsville, Neversink, Pepacton, Rondout, and Schoharie) were performed to provide updated capacity tables and bathymetric maps. Depths were surveyed with a single-beam echo sounder and real-time kinematic global positioning system (RTK-GPS) along planned transects at predetermined intervals for each reservoir. A separate set of echo sounder data was collected along transects at oblique angles to the main transects for accuracy assessment. Field survey data was combined with water-surface elevations in a geographic information system to create three-dimensional surfaces representing reservoir-bed elevations in the...
Categories: Data;
Types: Citation;
Tags: GPS measurement,
Rondout Reservoir,
Sullivan County,
Ulster County,
bathymetry,
Layered geospatial PDF 7.5 Minute Quadrangle Map. Layers of geospatial data include orthoimagery, roads, grids, geographic names, elevation contours, hydrography, and other selected map features. This map is derived from GIS (geospatial information system) data. It represents a repackaging of GIS data in traditional map form, not creation of new information. The geospatial data in this map are from selected National Map data holdings and other government sources.
Layered geospatial PDF 7.5 Minute Quadrangle Map. Layers of geospatial data include orthoimagery, roads, grids, geographic names, elevation contours, hydrography, and other selected map features. This map is derived from GIS (geospatial information system) data. It represents a repackaging of GIS data in traditional map form, not creation of new information. The geospatial data in this map are from selected National Map data holdings and other government sources.
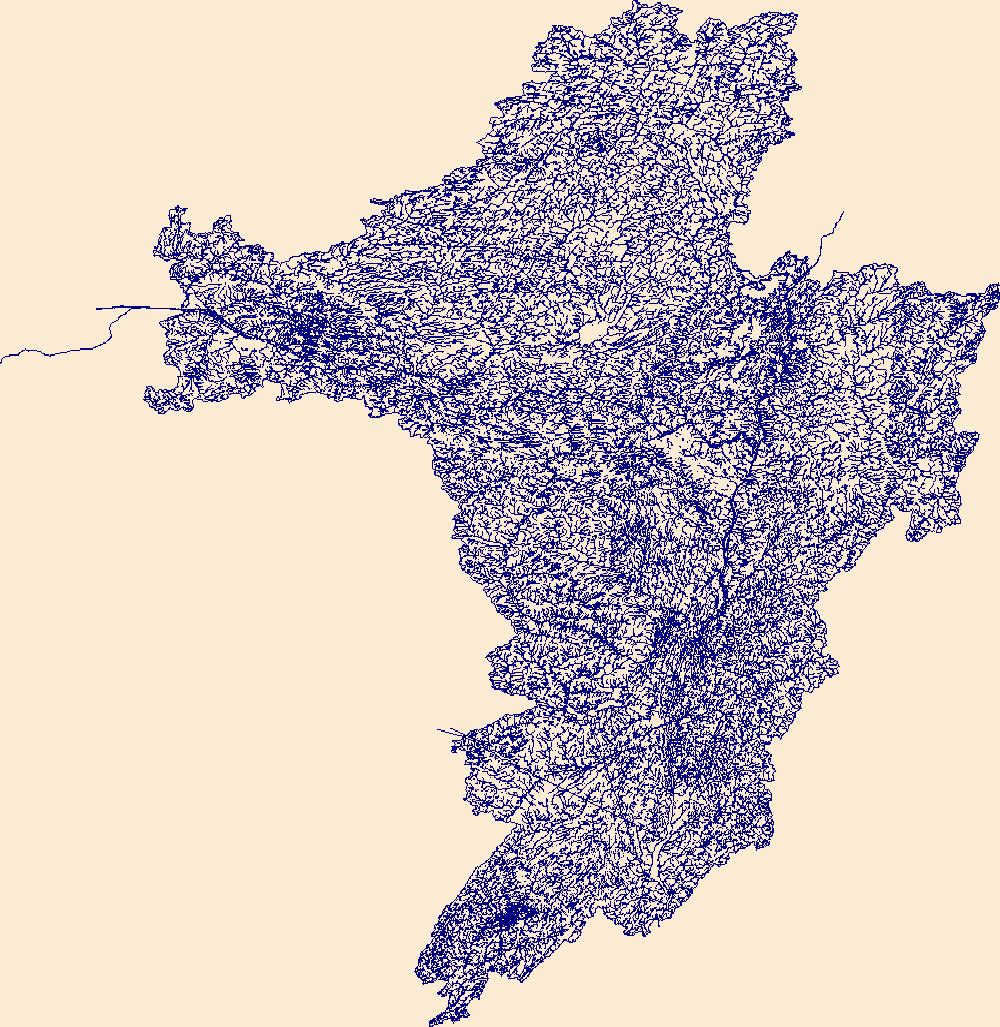
The High Resolution National Hydrography Dataset Plus (NHDPlus HR) is an integrated set of geospatial data layers, including the National Hydrography Dataset (NHD), National Watershed Boundary Dataset (WBD), and 3D Elevation Program Digital Elevation Model (3DEP DEM). The NHDPlus HR combines the NHD, 3DEP DEMs, and WBD to a data suite that includes the NHD stream network with linear referencing functionality, the WBD hydrologic units, elevation-derived catchment areas for each stream segment, "value added attributes" (VAAs), and other features that enhance hydrologic data analysis and routing.
This dataset contains the results from aging and back-calculation of length-at-age of scale samples from 502 Rainbow Trout captured in the Ashokan Reservoir between 1952 and 2017. The first six columns contain collection information including an assigned fish number, the year and period of capture, the basin of the Ashokan Reservoir from which a fish was captured, and the length and weight of the fish when it was captured. The final three columns present results from the aging and back-calculation procedures. Multiple rows of information often correspond to an individual fish and are designated by the "Fish number" column.
Categories: Data;
Tags: Alewife,
Ashokan Reservoir,
Catskill Mountains,
Esopus Creek,
Rainbow Trout,
From 2013 to 2015, bathymetric surveys of New York City’s six West of Hudson reservoirs (Ashokan, Cannonsville, Neversink, Pepacton, Rondout, and Schoharie) were performed to provide updated capacity tables and bathymetric maps. Depths were surveyed with a single-beam echo sounder and real-time kinematic global positioning system (RTK-GPS) along planned transects at predetermined intervals for each reservoir. A separate set of echo sounder data was collected along transects at oblique angles to the main transects for accuracy assessment. Field survey data was combined with water-surface elevations in a geographic information system to create three-dimensional surfaces representing reservoir-bed elevations in the...
Categories: Data;
Types: Citation,
Downloadable,
Map Service,
OGC WFS Layer,
OGC WMS Layer,
Shapefile;
Tags: Ashokan Reservoir,
GPS measurement,
Ulster County,
bathymetry,
single-beam echo sounder
Layered geospatial PDF 7.5 Minute Quadrangle Map. Layers of geospatial data include orthoimagery, roads, grids, geographic names, elevation contours, hydrography, and other selected map features. This map is derived from GIS (geospatial information system) data. It represents a repackaging of GIS data in traditional map form, not creation of new information. The geospatial data in this map are from selected National Map data holdings and other government sources.
Layered geospatial PDF 7.5 Minute Quadrangle Map. Layers of geospatial data include orthoimagery, roads, grids, geographic names, elevation contours, hydrography, and other selected map features. This map is derived from GIS (geospatial information system) data. It represents a repackaging of GIS data in traditional map form, not creation of new information. The geospatial data in this map are from selected National Map data holdings and other government sources.
Layered geospatial PDF 7.5 Minute Quadrangle Map. Layers of geospatial data include orthoimagery, roads, grids, geographic names, elevation contours, hydrography, and other selected map features. This map is derived from GIS (geospatial information system) data. It represents a repackaging of GIS data in traditional map form, not creation of new information. The geospatial data in this map are from selected National Map data holdings and other government sources.
Layered geospatial PDF 7.5 Minute Quadrangle Map. Layers of geospatial data include orthoimagery, roads, grids, geographic names, elevation contours, hydrography, and other selected map features. This map is derived from GIS (geospatial information system) data. It represents a repackaging of GIS data in traditional map form, not creation of new information. The geospatial data in this map are from selected National Map data holdings and other government sources.
Layered geospatial PDF 7.5 Minute Quadrangle Map. Layers of geospatial data include orthoimagery, roads, grids, geographic names, elevation contours, hydrography, and other selected map features. This map is derived from GIS (geospatial information system) data. It represents a repackaging of GIS data in traditional map form, not creation of new information. The geospatial data in this map are from selected National Map data holdings and other government sources.
Layered geospatial PDF 7.5 Minute Quadrangle Map. Layers of geospatial data include orthoimagery, roads, grids, geographic names, elevation contours, hydrography, and other selected map features. This map is derived from GIS (geospatial information system) data. It represents a repackaging of GIS data in traditional map form, not creation of new information. The geospatial data in this map are from selected National Map data holdings and other government sources.
This dataset includes spreadsheets with statistical data (mean and median absolute error) used in deciding which interpolation method best fit the corresponding dataset. All statistical data were paired with a visual inspection of the interpolation prior to determining the final raster product. All spreadsheets were generated using an automated python script (Jahn, 2020).
This dataset includes well logs used in the creation of the Cincinnatus hydrogeologic framework. Well logs were used from multiple sources (DEC, DOT, NWIS) and were a crucial component in generating hydrogeologic layer elevations and thicknesses. Well logs are available in their original form on GeoLog Locator (https://webapps.usgs.gov/GeoLogLocator/#!/) and provided here in the digitized form (shapefiles and feature classes), which were used in the generation of the hydrogeologic framework.
Layered geospatial PDF 7.5 Minute Quadrangle Map. Layers of geospatial data include orthoimagery, roads, grids, geographic names, elevation contours, hydrography, and other selected map features. This map is derived from GIS (geospatial information system) data. It represents a repackaging of GIS data in traditional map form, not creation of new information. The geospatial data in this map are from selected National Map data holdings and other government sources.
|

|
