Filters: Tags: Utah (X) > Date Range: {"choice":"year"} (X)
8,312 results (40ms)|
Filters
Date Types (for Date Range)
Types
Contacts
Categories Tag Types
|
The Colorado Plateau structural province features long monoclinal flexures between uplifts and basins that are the major lines of deformation within and marginal to the Plateau. These folds are named, well-known, and have been described as part of several previous tectonic syntheses of the Colorado Plateau (Kelley, 1955; Davis, 1978; 1999). However, no digital data have ever been created that locate these folds in digital map space. This digital dataset compiles mapped locations of monoclinal folds from several geologic maps from the Colorado Plateau, most released only in “paper”, non-vector format. Fold names and their general map trace were guided by regional-scale maps that synthesize the tectonic elements of...
This data release documents proposed updates to geologic inputs (faults) for the upcoming 2023 National Seismic Hazard Model (NSHM). This version (1.0) conveys differences between 2014 NSHM fault sources and those recently released in the earthquake geology inputs for the U.S. National Seismic Hazard Model (NSHM) 2023, version 1.0 data release by Hatem et al. (2021). A notable difference between the 2014 and 2023 datasets is that slip rates are provided at points for 2023 instead of generalized along the entire fault section length as in 2014; consequently, slip rates are not provided for fault sections in the draft 2023 dataset. Geospatial data (shapefile, kml and geojson) are provided in this data release with...
Categories: Data;
Types: Downloadable,
Map Service,
OGC WFS Layer,
OGC WMS Layer,
Shapefile;
Tags: Arizona,
California,
Colorado,
Idaho,
Nevada,
For the past six years, the Bureau of Reclamation (BOR) has funded the USGS to study fish responses to restoration efforts and to construct a model relating stream habitat with fish population dynamics in the Methow River Basin, a tributary of the Columbia River. In the proposed study, we will use fish growth, distribution and movement (USGS data), foodweb data (Idaho State University), river flow (BOR data that we will expand) and water temperature data (from numerous agencies) to develop spatially-explicit bioenergetics models to assess effects of climate change on the viability of resident salmonid populations based on models being developed by USGS. The bioenergetics models will integrate such things as climate-change...
Categories: Data,
Project;
Types: Map Service,
OGC WFS Layer,
OGC WMS Layer,
OGC WMS Service;
Tags: Alberta,
British Columbia,
Bull Trout,
Climate Change,
Climate Change,
The GNLCC Multi-dimensional Synthesis is a synthesis of existing information in four categories to promote a common understanding of situation, existing information and information gaps, as well as providing an index of programmatic, resource and other climate and landscape related information for GNLCC. The synthesis includes: the GNLCC Resource Directory (organizations and initiatives); climate and ecological response (what does existing and projected climate information say and what are expected ecological effects); and monitoring (who is monitoring what).FY2011Objectives:Provide a Framework from which to organize the various monitoring and evaluation efforts. Included are key monitoring and evaluation questions...
Categories: Data,
Project;
Types: Map Service,
OGC WFS Layer,
OGC WMS Layer,
OGC WMS Service;
Tags: Alberta,
British Columbia,
CO-2,
CO-3,
CO-3,
We propose a collaborative project with the USGS, Wyoming State Climate Office, USFWS, USFS, and the NPS whereby we will assemble and maintain long-term records of climate from key stations in and around the Great Northern LCC and subject these records to a rigorous series of QA/QC procedures. Where appropriate we will use best available practices to infill missing data, and we will develop station histories (e.g., details of station moves, instrumentation changes, etc.) as a context for interpreting these records. We will then rigorously analyze patterns of long-term (50-100 years) variability and trends in these datasets, and provide summaries designed to meet the needs of non-climate specialists working in the...
Categories: Data,
Project;
Types: Map Service,
OGC WFS Layer,
OGC WMS Layer,
OGC WMS Service;
Tags: Alberta,
British Columbia,
CO-2,
CO-3,
CO-3,
WGFD has a quantity of GPS-based animal movement data available for processing. In order to fully integrate this data into existing statewide migration route data layers and/or to use it to develop modeled migration corridor data layers, it must be reviewed, organized appropriately, analyzed, modeled and finally structured to allow seamless integration. The objective of this proposal is to review and examine the data, organize it meaningfully, and present it initially in combination with existing migration routes in order to represent generalized big game migration corridors across the landscapes of Wyoming. This is anticipated as a “first look” product, and serve as a basis for future work to more fully analyze...
Categories: Data,
Project;
Types: Map Service,
OGC WFS Layer,
OGC WMS Layer,
OGC WMS Service;
Tags: 2010,
2012,
CO-2,
CO-3,
CO-3,
(NWI) protocols to provide complete NWI coverage for the state of Idaho. Where hard copy maps are unavailable, habitat will be interpreted and digital data will be completed by contractors/cooperators.Main goal is to develop digital data compliant with NWI protocol for wetlands and riparian habitats in Montana and Idaho. Existing hard copy maps will be digitized according to standard NWI protocols to provide complete NWI coverage for the state of Idaho. Where hard copy maps are unavailable, habitat will be interpreted and digital data will be completed by contractors/cooperators.
These data were compiled to create models that estimate entrainment rates and population growth rates of smallmouth bass below Glen Canyon Dam. Objective(s) of our study were to predict smallmouth bass entrainment rates and population growth under different future scenarios of Lake Powell elevations and management. These data represent parameters needed for associated models and data needed to produce figures. These data were collected from publicly available online sources including published papers and federal government datasets. These data were assembled by researchers from U.S. Geological Survey, Utah State University, Colorado State University, U.S. Fish and Wildlife Service. These data can be used to run...
Album caption: General view of canyon wall near Camp Wylie. Red Kanab sandstone below and white Colob sandstone above. Utah.
Categories: Image;
Tags: Lee, W.T. Collection,
National Parks,
Photographers,
Utah,
Zion National Park,
Album caption: Kanab sandstone. Walls about 2000 feet. Zion Canyon. Utah. Index card: Canyon walls 2,000 feet high. Zion National Park.
Categories: Image;
Types: Map Service,
OGC WFS Layer,
OGC WMS Layer,
OGC WMS Service;
Tags: Lee, W.T. Collection,
National Parks,
Photographers,
Utah,
Zion National Park,
Geospatial data includes structures and other selected map features.
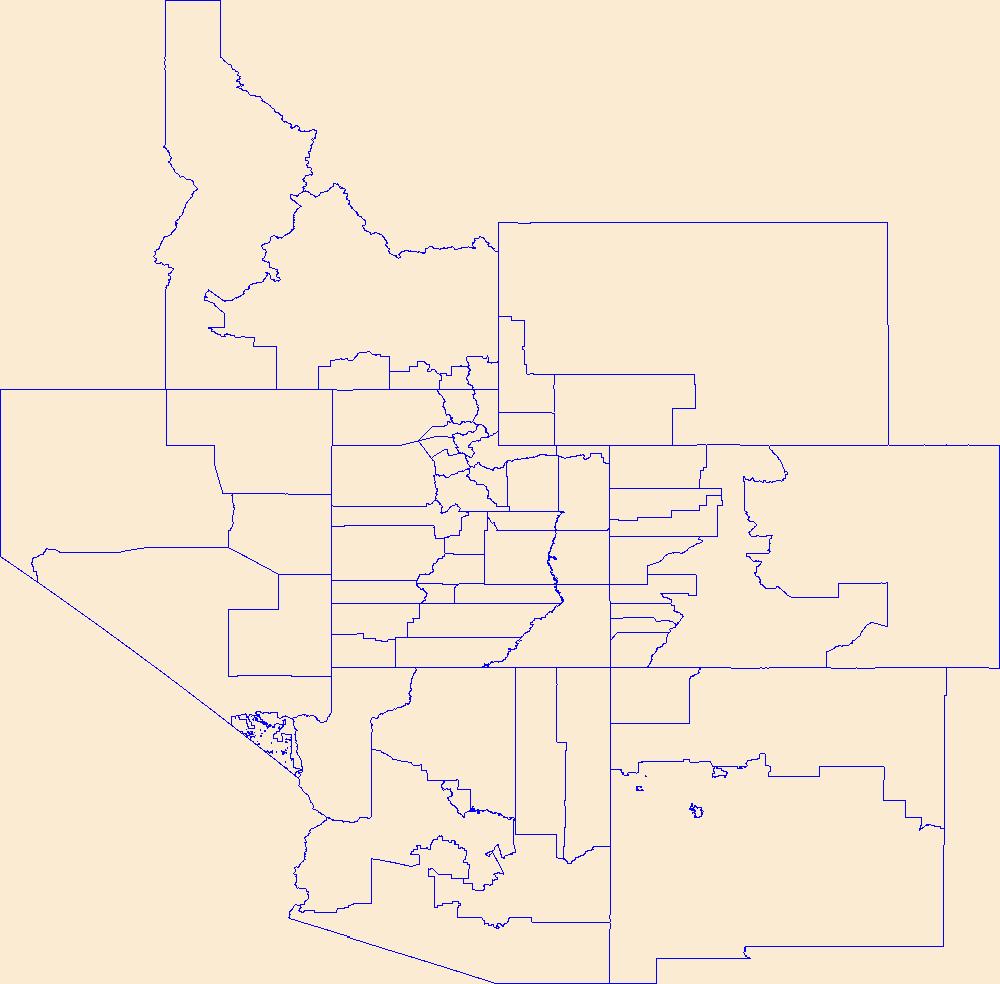
Geospatial data is comprised of government boundaries.
Across the country, public land managers make hundreds of decisions each year that influence landscapes and ecosystems within the lands they manage. Many of these decisions involve vegetation manipulations known as land treatments. Land treatments include activities such as removal or alteration of plant biomass, seeding burned areas, and herbicide applications. Data on these land treatments historically have been stored at local offices and gathering information across large spatial areas was difficult. These valuable data needed to be centralized and stored for Federal agencies involved in land treatments because these data are useful to land managers for policy and management and to scientists for developing...
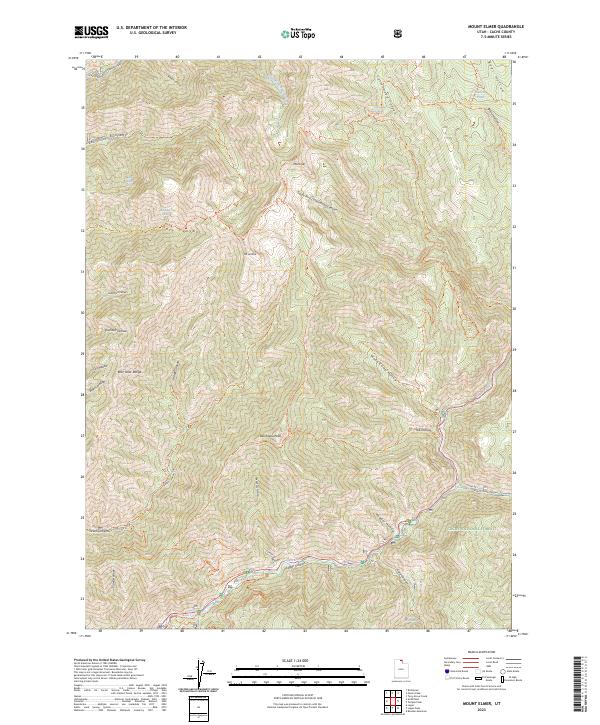
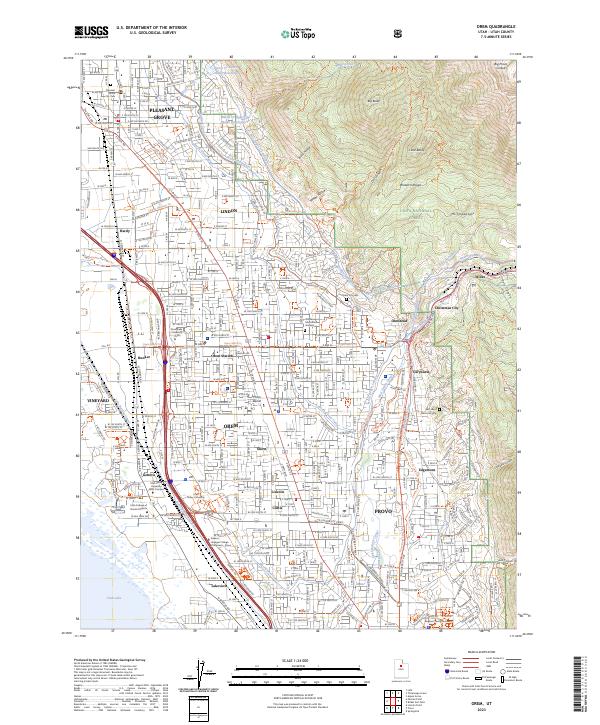
Layered geospatial PDF 7.5 Minute Quadrangle Map. Layers of geospatial data include orthoimagery, roads, grids, geographic names, elevation contours, hydrography, and other selected map features. This map is derived from GIS (geospatial information system) data. It represents a repackaging of GIS data in traditional map form, not creation of new information. The geospatial data in this map are from selected National Map data holdings and other government sources.
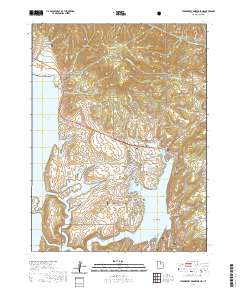
Layered geospatial PDF 7.5 Minute Quadrangle Map. Layers of geospatial data include orthoimagery, roads, grids, geographic names, elevation contours, hydrography, and other selected map features. This map is derived from GIS (geospatial information system) data. It represents a repackaging of GIS data in traditional map form, not creation of new information. The geospatial data in this map are from selected National Map data holdings and other government sources.
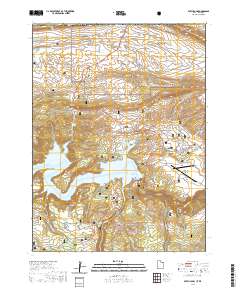
Layered geospatial PDF 7.5 Minute Quadrangle Map. Layers of geospatial data include orthoimagery, roads, grids, geographic names, elevation contours, hydrography, and other selected map features. This map is derived from GIS (geospatial information system) data. It represents a repackaging of GIS data in traditional map form, not creation of new information. The geospatial data in this map are from selected National Map data holdings and other government sources.
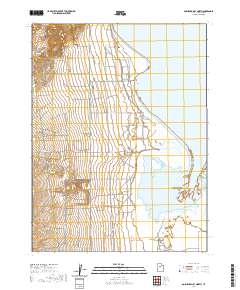
Layered geospatial PDF 7.5 Minute Quadrangle Map. Layers of geospatial data include orthoimagery, roads, grids, geographic names, elevation contours, hydrography, and other selected map features. This map is derived from GIS (geospatial information system) data. It represents a repackaging of GIS data in traditional map form, not creation of new information. The geospatial data in this map are from selected National Map data holdings and other government sources.
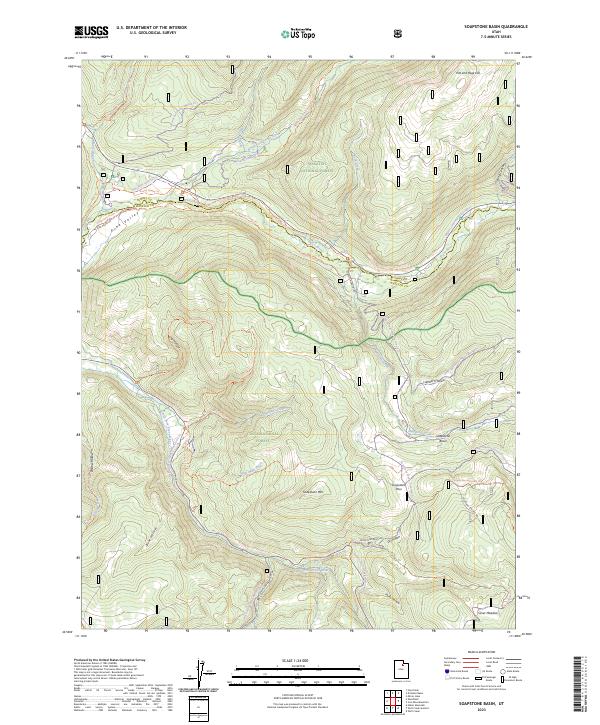
Layered geospatial PDF 7.5 Minute Quadrangle Map. Layers of geospatial data include orthoimagery, roads, grids, geographic names, elevation contours, hydrography, and other selected map features. This map is derived from GIS (geospatial information system) data. It represents a repackaging of GIS data in traditional map form, not creation of new information. The geospatial data in this map are from selected National Map data holdings and other government sources.
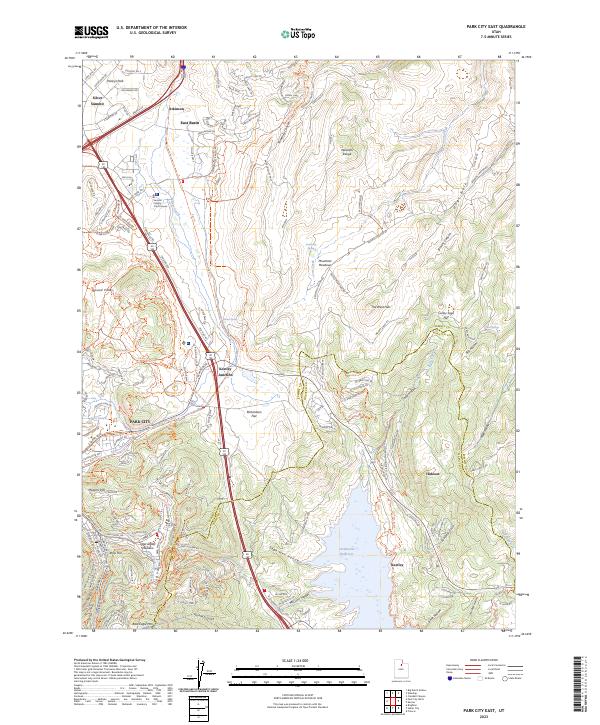
Layered geospatial PDF 7.5 Minute Quadrangle Map. Layers of geospatial data include orthoimagery, roads, grids, geographic names, elevation contours, hydrography, and other selected map features. This map is derived from GIS (geospatial information system) data. It represents a repackaging of GIS data in traditional map form, not creation of new information. The geospatial data in this map are from selected National Map data holdings and other government sources.
Layered geospatial PDF 7.5 Minute Quadrangle Map. Layers of geospatial data include orthoimagery, roads, grids, geographic names, elevation contours, hydrography, and other selected map features. This map is derived from GIS (geospatial information system) data. It represents a repackaging of GIS data in traditional map form, not creation of new information. The geospatial data in this map are from selected National Map data holdings and other government sources.
|

|
