Filters: Tags: Vancouver (X)
32 results (84ms)|
Filters
Contacts
(Less)
|
This data release comprises a dataset that contains sample collection information and microsatellite genotypes, and another dataset that contains single nucleotide polymorphism (SNP) genotypes with sample collection information for populations of white-tailed ptarmigan across the species' range. There is also an additional file (accession numbers.xlsx) linking samples to accession numbers in Genbank. This data was collected in order to address the following: The delineation of intraspecific units that are evolutionarily and demographically distinct is an important step in the development of species-specific management plans. Neutral genetic variation has served as the primary data source for delineating units for...
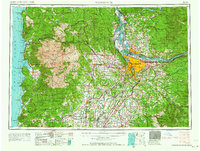
USGS Historical Quadrangle in GeoPDF.
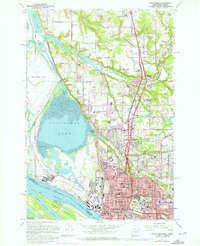
USGS Historical Quadrangle in GeoPDF.
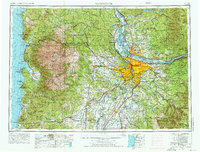
USGS Historical Quadrangle in GeoPDF.
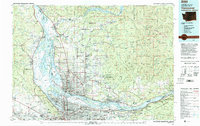
USGS Historical Quadrangle in GeoPDF.
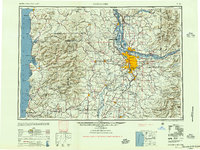
USGS Historical Quadrangle in GeoPDF.
The Sea Surface Temperature (SST) data of the nearshore region of the North Pacific show temperature ranges in degrees C using points whose locations correspond to the centroids of AVHRR Pathfinder version 5 monthly, global, 4 km data set (PFSST V50). The pathfinder rasters are available from the Physical Oceanography Distributed Active Archive Center (PO.DAAC), hosted by NASA JPL. The data points in this dataset lie within a 20 km buffer from the GSHHS (Global Self-consistent, Hierarchical, High-resolution Shoreline) coastline. The GSHHS vector data are available from the National Geophysical Data Center (NGDC). Furthermore, each point in the SST dataset is categorized by the ecoregion in which it is located. This...
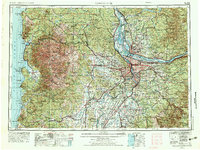
USGS Historical Quadrangle in GeoPDF.
This data set contains imagery from the National Agriculture Imagery Program (NAIP). The NAIP program is administered by USDA FSA and has been established to support two main FSA strategic goals centered on agricultural production. These are, increase stewardship of America's natural resources while enhancing the environment, and to ensure commodities are procured and distributed effectively and efficiently to increase food security. The NAIP program supports these goals by acquiring and providing ortho imagery that has been collected during the agricultural growing season in the U.S. The NAIP ortho imagery is tailored to meet FSA requirements and is a fundamental tool used to support FSA farm and conservation programs....
USGS Historical Quadrangle in GeoPDF.

USGS Historical Quadrangle in GeoPDF.
This archive documents five 30-year SUTRA simulations summarized in Burns at al. (2020), and provides output from one short (2-year) simulation to allow verification that the archive model code runs properly. A modified version of SUTRA 2.2 was used to evaluate Reservoir Thermal Energy Storage by simulating layered system conditions (grid spacing varies depending on simulation run time to prevent boundary effects). This version of SUTRA is summarized in Burns et al. (2015), but in short, the primary differences from the current public-release version (v3) are that cell-by-cell thermal and hydraulic properties can be defined (allowing representation of the layered Portland system) and viscosity and density of water...
This data set contains imagery from the National Agriculture Imagery Program (NAIP). The NAIP program is administered by USDA FSA and has been established to support two main FSA strategic goals centered on agricultural production. These are, increase stewardship of America's natural resources while enhancing the environment, and to ensure commodities are procured and distributed effectively and efficiently to increase food security. The NAIP program supports these goals by acquiring and providing ortho imagery that has been collected during the agricultural growing season in the U.S. The NAIP ortho imagery is tailored to meet FSA requirements and is a fundamental tool used to support FSA farm and conservation programs....
This data set contains imagery from the National Agriculture Imagery Program (NAIP). The NAIP program is administered by USDA FSA and has been established to support two main FSA strategic goals centered on agricultural production. These are, increase stewardship of America's natural resources while enhancing the environment, and to ensure commodities are procured and distributed effectively and efficiently to increase food security. The NAIP program supports these goals by acquiring and providing ortho imagery that has been collected during the agricultural growing season in the U.S. The NAIP ortho imagery is tailored to meet FSA requirements and is a fundamental tool used to support FSA farm and conservation programs....
This data release consists of high quality georeferenced orthophoto mosaics of a 160 kilometer long portion of the Columbia River between Portland and The Dalles, Oregon created from aerial photographs collected in 1935 by the U.S. Army Corps of Engineers. The dataset comprises three GeoTIFF files, each covering about 40-60 kilometers. This metadata document summarizes the entire data release. See attached metadata records for information on the individual mosaics.
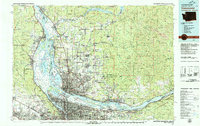
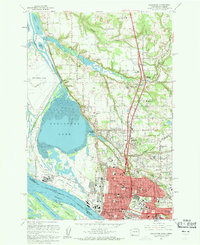
USGS Historical Quadrangle in GeoPDF.
USGS Historical Quadrangle in GeoPDF.
This point shapefile approximates locations within 20 km of the North Pacific Coastline, as defined by the "World Country Boundaries (Generalized)" shapefile distributed by ESRI as part of their Data & Maps data series. They are based on raster data at 4 km resolution. Therefore there are between 3-5 points extending out from each location along the shoreline (at 4 km intervals).
Categories: Data;
Types: Citation,
Downloadable,
Map Service,
OGC WFS Layer,
OGC WMS Layer,
Shapefile;
Tags: Aleutian,
Asian Pacific,
BC,
Baja,
British Columbia,
This data set contains imagery from the National Agriculture Imagery Program (NAIP). The NAIP program is administered by USDA FSA and has been established to support two main FSA strategic goals centered on agricultural production. These are, increase stewardship of America's natural resources while enhancing the environment, and to ensure commodities are procured and distributed effectively and efficiently to increase food security. The NAIP program supports these goals by acquiring and providing ortho imagery that has been collected during the agricultural growing season in the U.S. The NAIP ortho imagery is tailored to meet FSA requirements and is a fundamental tool used to support FSA farm and conservation programs....
The Sea Surface Temperature (SST) data of the nearshore region of the North Pacific show temperature ranges in degrees C using points whose locations correspond to the centroids of AVHRR Pathfinder version 5 monthly, global, 4 km data set (PFSST V50). The pathfinder rasters are available from the Physical Oceanography Distributed Active Archive Center (PO.DAAC), hosted by NASA JPL. The data points in this dataset lie within a 20 km buffer from the GSHHS (Global Self-consistent, Hierarchical, High-resolution Shoreline) coastline. The GSHHS vector data are available from the National Geophysical Data Center (NGDC). Furthermore, each point in the SST dataset is categorized by the ecoregion in which it is located. This...
|

|
