Filters: Tags: Vector (X)
9 results (255ms)|
Filters
Date Range
Extensions (Less) Types (Less) Contacts (Less)
Categories (Less) Tag Types
|
How much does real GDP respond to unanticipated changes in the real price of oil? Commonly used censored VAR models suggest a substantial decline in real GDP in response to unexpected increases in the real price of oil, yet no response to unexpected declines. We show that these estimates are invalid. Based on a structural model that encompasses both symmetric and asymmetric models as special cases, correctly computed impulse responses are of roughly the same magnitude in either direction, consistent with formal tests for symmetric responses. We discuss implications for theoretical models and for policy responses to energy price shocks.
Categories: Publication;
Types: Citation;
Tags: Asymmetry,
autoregression.,
energy prices,
net increase,
oil price,
Under the direction and funding of the National Cooperative Geologic Mapping Program (NCGMP) with guidance and encouragement from the United States Geological Survey (USGS), there has been a decadal strategic plan in place to call for geologic mapping across the nation. This call has been increasing the need for digital data that has not yet been made available. With such a demand, physical data is being re-released as vector-based, GIS operable data, which is viable as a corporate asset to the USGS. This collection of reports is part of the compilation and synthesis efforts hampered by the distributed nature of subsurface investigations at the USGS and a general lack of cataloging and archiving of 3-D geological...
Categories: Data;
Types: Map Service,
OGC WFS Layer,
OGC WMS Layer,
OGC WMS Service;
Tags: Almond Formation,
Arizona,
Baxter Shale,
Castlegate Sandstone,
Colorado,
As one of the cornerstones of the U.S. Geological Survey's (USGS) National Geospatial Program, The National Map is a collaborative effort among the USGS and other Federal, State, and local partners to improve and deliver topographic information for the Nation. It has many uses ranging from recreation to scientific analysis to emergency response. The National Map is easily accessible for display on the Web, as products and services, and as downloadable data. The geographic information available from The National Map includes orthoimagery (aerial photographs), elevation, geographic names, hydrography, boundaries, transportation, structures, and land cover.
How much does real GDP respond to unanticipated changes in the real price of oil? Commonly used censored VAR models suggest a substantial decline in real GDP in response to unexpected increases in the real price of oil, yet no response to unexpected declines. We show that these estimates are invalid. Based on a structural model that encompasses both symmetric and asymmetric models as special cases, correctly computed impulse responses are of roughly the same magnitude in either direction, consistent with formal tests for symmetric responses. We discuss implications for theoretical models and for policy responses to energy price shocks.
Categories: Publication;
Types: Citation;
Tags: Asymmetry,
autoregression.,
energy prices,
net increase,
oil price,
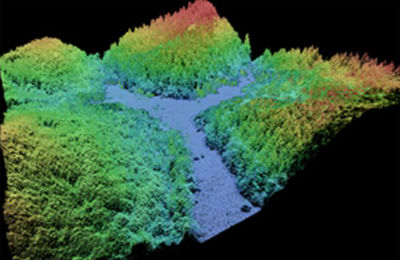
This data collection of the 3D Elevation Program (3DEP) consists of Lidar Point Cloud (LPC) projects as provided to the USGS. These point cloud files contain all the original lidar points collected, with the original spatial reference and units preserved. These data may have been used as the source of updates to the 1/3-arcsecond, 1-arcsecond, and 2-arcsecond seamless 3DEP Digital Elevation Models (DEMs). The 3DEP data holdings serve as the elevation layer of The National Map, and provide foundational elevation information for earth science studies and mapping applications in the United States. Lidar (Light detection and ranging) discrete-return point cloud data are available in LAZ format. The LAZ format is a lossless...

TIGER, TIGER/Line, and Census TIGER are registered trademarks of the Bureau of the Census. The Redistricting Census 2000 TIGER/Line files are an extract of selected geographic and cartographic information from the Census TIGER data base. The geographic coverage for a single TIGER/Line file is a county or statistical equivalent entity, with the coverage area based on January 1, 2000 legal boundaries. A complete set of Redistricting Census 2000 TIGER/Line files includes all counties and statistically equivalent entities in the United States and Puerto Rico. The Redistricting Census 2000 TIGER/Line files will not include files for the Island Areas. The Census TIGER data base represents a seamless national file with...
The Sea Surface Temperature (SST) data of the nearshore region of the North Pacific show temperature ranges in degrees C using points whose locations correspond to the centroids of AVHRR Pathfinder version 5 monthly, global, 4 km data set (PFSST V50). The pathfinder rasters are available from the Physical Oceanography Distributed Active Archive Center (PO.DAAC), hosted by NASA JPL. The data points in this dataset lie within a 20 km buffer from the GSHHS (Global Self-consistent, Hierarchical, High-resolution Shoreline) coastline. The GSHHS vector data are available from the National Geophysical Data Center (NGDC). Furthermore, each point in the SST dataset is categorized by the ecoregion in which it is located. This...
These data were released prior to the October 1, 2016 effective date for the USGS’s policy dictating the review, approval, and release of scientific data as referenced in USGS Survey Manual Chapter 502.8 Fundamental Science Practices: Review and Approval of Scientific Data for Release. This vector coverage of hydrography centerlines was derived from the National Hydrography Dataset (NHD), and encompasses all of Ohio and portions of Indiana, Michigan, Kentucky, West Virginia, Pennsylvania, and New York. This coverage is comprised of 105 Catalog Units (CUs) obtained from http://nhd.usgs.gov/. Each CU approximately represents a single 8-digit Hydrologic Unit Code (HUC).
How much does real GDP respond to unanticipated changes in the real price of oil? Commonly used censored VAR models suggest a substantial decline in real GDP in response to unexpected increases in the real price of oil, yet no response to unexpected declines. We show that these estimates are invalid. Based on a structural model that encompasses both symmetric and asymmetric models as special cases, correctly computed impulse responses are of roughly the same magnitude in either direction, consistent with formal tests for symmetric responses. We discuss implications for theoretical models and for policy responses to energy price shocks.
Categories: Publication;
Types: Citation;
Tags: Asymmetry,
autoregression.,
energy prices,
net increase,
oil price,
|

|
