Filters: Tags: Vegetation (X) > partyWithName: Conservation Biology Institute (X)
435 results (15ms)|
Filters
Date Range
Types Contacts
Tag Types Tag Schemes |
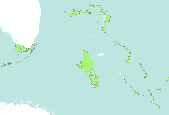
These maps are a digital representation of the individual tree species range maps of the Atlas of the United States Trees by Elbert L. Little, Jr. The atlas shows the natural distribution or range of the native tree species of North America. These coverages represent 3 volumes of the atlas. Little's tree extent maps can be found in the Data Basin gallery here: http://app.databasin.org/app/pages/galleryPage.jsp?id=5e449f3c91304f498a96299a9d5460a3
These maps are a digital representation of the individual tree species range maps of the Atlas of the United States Trees by Elbert L. Little, Jr. The atlas shows the natural distribution or range of the native tree species of North America. These coverages represent 3 volumes of the atlas. Little's tree extent maps can be found in the Data Basin gallery here: http://app.databasin.org/app/pages/galleryPage.jsp?id=5e449f3c91304f498a96299a9d5460a3

These maps are a digital representation of the individual tree species range maps of the Atlas of the United States Trees by Elbert L. Little, Jr. The atlas shows the natural distribution or range of the native tree species of North America. These coverages represent 3 volumes of the atlas. Little's tree extent maps can be found in the Data Basin gallery here: http://app.databasin.org/app/pages/galleryPage.jsp?id=5e449f3c91304f498a96299a9d5460a3
The Nature Conservancy (TNC) has derived climate suitability forecasts for most species of trees and shrubs considered to be ecological dominants of terrestrial Californian habitat types. Our plant projections are compiled as decision support tools to help Conservancy project staff, as well as our external partners, develop the necessary plans, priorities and strategies to successfully adapt to uncertain changes in future climate. In the recently completed Southern Sierra Partnership's 2010 Climate-Adapted Conservation Plan for the Southern Sierra Nevada and Tehachapi Mountains, species and habitat forecasts shown here informed the development of a regional conservation design that explicitly incorporates long-term...

The dynamic vegetation model MC2 used a suite of climate futures from the Coupled Model Intercomparison Project (CMIP5, http://cmip-pcmdi.llnl.gov/cmip5/ downscaled using a fairly new statistical downscaling approach (Abatzoglou 2011), Multivariate Adaptive Constructed Analogs (MACA), over the western US. The vegetation model was run on the NASA Earth Exchange (NEX) platform at 4km resolution for 2 representative concentration pathways (RCPs) 8.5 and 4.5 (Moss et al. 2010, van Vuuren et. al 2011). Representative Concentration Pathway define a specific emissions trajectory and subsequent radiative forcing. Radiative forcing is a measure of the influence a factor has in altering the balance of incoming and outgoing...

The dynamic vegetation model MC2 used a suite of climate futures from the Coupled Model Intercomparison Project (CMIP5, http://cmip-pcmdi.llnl.gov/cmip5/ downscaled using a fairly new statistical downscaling approach (Abatzoglou 2011), Multivariate Adaptive Constructed Analogs (MACA), over the western US. The vegetation model was run on the NASA Earth Exchange (NEX) platform at 4km resolution for 2 representative concentration pathways (RCPs) 8.5 and 4.5 (Moss et al. 2010, van Vuuren et. al 2011). Representative Concentration Pathway define a specific emissions trajectory and subsequent radiative forcing. Radiative forcing is a measure of the influence a factor has in altering the balance of incoming and outgoing...

The dynamic vegetation model MC2 used a suite of climate futures from the Coupled Model Intercomparison Project (CMIP5, http://cmip-pcmdi.llnl.gov/cmip5/ downscaled using a fairly new statistical downscaling approach (Abatzoglou 2011), Multivariate Adaptive Constructed Analogs (MACA), over the western US. The vegetation model was run on the NASA Earth Exchange (NEX) platform at 4km resolution for 2 representative concentration pathways (RCPs) 8.5 and 4.5 (Moss et al. 2010, van Vuuren et. al 2011). Representative Concentration Pathway define a specific emissions trajectory and subsequent radiative forcing. Radiative forcing is a measure of the influence a factor has in altering the balance of incoming and outgoing...

The dynamic vegetation model MC2 used a suite of climate futures from the Coupled Model Intercomparison Project (CMIP5, http://cmip-pcmdi.llnl.gov/cmip5/ downscaled using a fairly new statistical downscaling approach (Abatzoglou 2011), Multivariate Adaptive Constructed Analogs (MACA), over the western US. The vegetation model was run on the NASA Earth Exchange (NEX) platform at 4km resolution for 2 representative concentration pathways (RCPs) 8.5 and 4.5 (Moss et al. 2010, van Vuuren et. al 2011). Representative Concentration Pathway define a specific emissions trajectory and subsequent radiative forcing. Radiative forcing is a measure of the influence a factor has in altering the balance of incoming and outgoing...

The dynamic vegetation model MC2 used a suite of climate futures from the Coupled Model Intercomparison Project (CMIP5, http://cmip-pcmdi.llnl.gov/cmip5/ downscaled using a fairly new statistical downscaling approach (Abatzoglou 2011), Multivariate Adaptive Constructed Analogs (MACA), over the western US. The vegetation model was run on the NASA Earth Exchange (NEX) platform at 4km resolution for 2 representative concentration pathways (RCPs) 8.5 and 4.5 (Moss et al. 2010, van Vuuren et. al 2011). Representative Concentration Pathway define a specific emissions trajectory and subsequent radiative forcing. Radiative forcing is a measure of the influence a factor has in altering the balance of incoming and outgoing...

The dynamic vegetation model MC2 used a suite of climate futures from the Coupled Model Intercomparison Project (CMIP5, http://cmip-pcmdi.llnl.gov/cmip5/ downscaled using a fairly new statistical downscaling approach (Abatzoglou 2011), Multivariate Adaptive Constructed Analogs (MACA), over the western US. The vegetation model was run on the NASA Earth Exchange (NEX) platform at 4km resolution for 2 representative concentration pathways (RCPs) 8.5 and 4.5 (Moss et al. 2010, van Vuuren et. al 2011). Representative Concentration Pathway define a specific emissions trajectory and subsequent radiative forcing. Radiative forcing is a measure of the influence a factor has in altering the balance of incoming and outgoing...

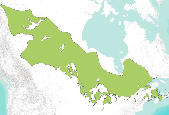
Dataset created by the Food and Agriculture Organization (FAO) to identify major global ecofloristic zones. It was used by the IPCC to categorize carbon stock estimates. Each of the 20 ecoregions are characterized by their temperature regime (tropical, subtropical, temperate, boreal, and polar) and their vegetation type (humid forest, dry forest, moist deciduous forest, shrubland, steppe, desert, etc.).

These maps are a digital representation of the individual tree species range maps of the Atlas of the United States Trees by Elbert L. Little, Jr. The atlas shows the natural distribution or range of the native tree species of North America. These coverages represent 3 volumes of the atlas. Little's tree extent maps can be found in the Data Basin gallery here: http://app.databasin.org/app/pages/galleryPage.jsp?id=5e449f3c91304f498a96299a9d5460a3

The California Department of Fish and Game (CDFG) Vegetation Classification and Mapping Program (VegCAMP) and contractor Aerial Information Systems (AIS) created a fine-scale vegetation map of a portion of the western Mojave Desert in California. The mapped area is bounded to the west and south by USDA Ecoregional Subsection 322Ag of the Mojave Desert (Miles and Goudey 1997). To the east, the portion mapped by AIS (approx. 4,202,000 acres) is bounded by the borders of a vegetation map produced in 2004 for the Mojave Desert Ecosystem Program (MDEP). VegCAMP mapped a portion of the area mapped previously for the MDEP (approx. 776,000 acres) using the finer-scale rules and classification that AIS used for the larger...
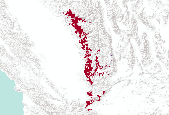
Mojave and Great Basin Upper Bajada and Toeslope distribution within the DRECP study area.This community was extracted from the Land/Use Natural Vegetation Communities dataset provided by Aerial Information Systems and the California Dept. of Fish and Game. Extractions were based on the GroupCommunity field.The California Department of Fish and Wildlife (CDFW) Vegetation Classification and Mapping Program (VegCAMP) and contractor Aerial Information Systems (AIS) created a fine-scale vegetation map of a portion of the western Mojave Desert in California. The mapped area is bounded to the west and south by USDA Ecoregional Subsection 322Ag of the Mojave Desert (Miles and Goudey 1997). To the east, the portion mapped...
Intermontane Deep or Well-Drained Soil Scrub distribution within the DRECP study area.This community was extracted from the Land/Use Natural Vegetation Communities dataset provided by Aerial Information Systems and the California Dept. of Fish and Game. Extractions were based on the GroupCommunity field.The California Department of Fish and Wildlife (CDFW) Vegetation Classification and Mapping Program (VegCAMP) and contractor Aerial Information Systems (AIS) created a fine-scale vegetation map of a portion of the western Mojave Desert in California. The mapped area is bounded to the west and south by USDA Ecoregional Subsection 322Ag of the Mojave Desert (Miles and Goudey 1997). To the east, the portion mapped by...

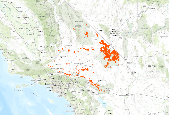
This dataset was created using the MC1 Dynamic Global Vegetation Model. It represents the mode of projected vegetation types for the time period 2041 to 2050 under the down-scaled CGCM3 Global Circulation Model under the A2 emissions scenario. The fire suppression condition was set for the model run. The spatial resolution is 30 arc seconds, and the extent is the four corners region of the southwestern USA (Utah, Colorado, Arizona and New Mexico).

This dataset was created using the MC1 Dynamic Global Vegetation Model. It represents the mode of projected vegetation types for the time period 2041 to 2050 under the down-scaled MIROC3 Global Circulation Model under the A2 emissions scenario. The fire suppression condition was set for the model run. The spatial resolution is 30 arc seconds, and the extent is the four corners region of the southwestern USA (Utah, Colorado, Arizona and New Mexico).

This map represents the change between 1971-2000 and 2070-2099 in the mean annual fraction of each gridcell affected by fire, as simulated by the model MC1 under the Hadley future climate projection and A2 anthropogenic emissions scenario. Data values are calculated as PART_BURN(2070-2099) minus PART_BURN(1971-2000). PART_BURN data is from MC1 version B60. The average annual fraction of cell burned for the respective 30-year periods increased in some of the 5,311 grid cells of the Apache-Sitgreaves study area and decreased in others. The range of data values is from -0.077 to +0.163. The mean value is +0.031. The vegetation model MC1 (e.g. Bachelet et al. 2001) was used to simulate vegetation dynamics, associated...

This map represents the change between 1971-2000 and 2071-2100 in the annual peak fraction of total live vegetation carbon held in herbaceous plants, as simulated by the model MC1 under the CSIRO Mk3 future climate projection and A2 anthropogenic emissions scenario. The range of data values is from -0.741 to +0.999. The mean value is +0.107. Data values are calculated as GFRAC(2071-2100) minus GFRAC(1971-2000). GFRAC data is from MC1 version B60. The dynamic global vegetation model MC1 (e.g. Bachelet et al. 2001) was used to simulate vegetation dynamics, associated carbon and nitrogen cycle, water budget, and wild fire impacts at two study sites in eastern Oregon (Deschutes and Fremont-Winema National Forests)...

This geospatial database covers vegetation land cover and land use for Wind Cave National Park and surrounding areas and is authorized as part of the USGS/NPS Vegetation Mapping Program <http://biology.usgs.gov/npsveg> . The program is administered by the Biological Resources Division (BRD) of the United States Geological Survey (USGS). This mapping effort was performed by the US Bureau of Reclamation's (USBR) Remote Sensing and GIS Group, Technical Service Center, Denver, CO. The vegetation mapping program is part of a larger Inventory and Monitoring (I&M) program started by the National Park Service (NPS) <http://science.nature.nps.gov/im/> . I&M goals are, among others, to map the vegetation of all national parks...
|

|
