Filters: Tags: Vulnerability (X) > partyWithName: Conservation Biology Institute (X)
34 results (68ms)|
Filters
Date Range
Extensions Contacts
Categories Tag Types
|

The 2006 National Insect and Disease Risk Map (NIDRM) Project integrates 188 individual risk models constructed within a common, consistent framework that accounts for regional variations in current and future forest health. The 2006 risk assessment, conducted within the contiguous United States and Alaska, provides a consistent, repeatable, transparent process through which interactive spatial and temporal risk assessments can be conducted at various scales to aid in the allocation of resources for forest health management. This modeling process is intended to increase the utilization of forest health risk maps within and outside the National Forest System and encourage development of future risk maps. NIDRM...

This dataset combines the sensitive soils datasets for the Southern Rockies Landscape Conservation Cooperative, the projected future vegetation and the simulated historic potential natural vegetation, created using the MC2 dynamic global vegetation model. Colors represent unique combinations of vegetation change and the number of sensitive soil factors present in a given area.

The acquisition of forest parameters by host species distributions is a significant factor in the identification of areas at risk of mortality to a particular agent. The most readily-available forest type maps do not contain enough location-specific information for insect and disease risk assessments, in particular species' age and stocking. Estimates for total and individual species' basal area (BA), quadratic mean diameter (QMD), stand density index (SDI), percent host composition, and predominant canopy position were developed for all 57 tree species and species groups modeled for the National Insect and Disease Risk Map. After extensively testing various interpolation methods, the Risk Map Integration Team...

The 2006 National Insect and Disease Risk Map (NIDRM) Project integrates 188 individual risk models constructed within a common, consistent framework that accounts for regional variations in current and future forest health. The 2006 risk map assessment, utilized within the contiguous United States and Alaska, provides a consistent, repeatable, transparent process through which interactive spatial and temporal risk assessments can be conducted at various scales to aid in the allocation of resources for forest health management. This modeling process is intended to increase the utilization of forest health risk maps within and outside the National Forest System and encourage development of future risk maps. NIDRM...

The acquisition of host species distributions is a significant factor in the identification of areas at risk of mortality to a particular agent. The most readily-available forest type maps do not contain enough location-specific information for insect and disease risk assessments, in particular species' age and stocking. Estimates for total and individual species' basal area (BA), quadratic mean diameter (QMD), stand density index (SDI), percent host composition, and predominant canopy position were developed for all 57 tree species and species groups modeled for the National Insect and Disease Risk Map. After extensively testing various interpolation methods, the Risk Map Integration Team (RMIT) utilized a...

Two maps (PCT_BALOSS_AK - the ArcInfo Grid referenced to this metadata - and PCT_BALOSS - see accompanying CONUS Grid and its associated metadata) represent, in map form, the comprehensive version of the final results of the 2006 National Insect and Disease Risk Map (NIDRM) Project. Specifically, their pixel values range from 0 to 100 percent, representing the predicted percent of basal area loss over the next 15 years due to insects and diseases.
This project integrates fire risk models, species distribution models (SDMs) and population models with scenarios of future climate and land cover to project how the effects of climate-induced changes to species distributions and land use change will impact threatened species in fire-prone ecosystems. This project also identifies and prioritizes potential management responses to climate change (e.g. assisted colonization, fire management, land protection, dispersal corridors). Anticipated products include: 1) maps (digital and hard copy) of habitat suitability under current and future climate change, current and future projected urban growth and combinations of climate change and future projected urban growth, under...
Categories: Data,
Project;
Tags: 2011,
Academics & scientific researchers,
CA,
CA-Southern,
California Landscape Conservation Cooperative,

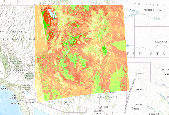
This dataset shows the number of vulnerability factors affecting the landscape in the Southern Rockies Conservation Cooperative. There can be from 0 to 9 factors (low available soil water capacity, high calcium carbonates, high gypsum content, low pH, high pH, shallow depth, high wind erodibility, high water erodibility, and high sodicity).

Two maps (this grid, CONUS_BALOSSI and AK_BALOSSI - see accompanying Grid and its associated metadata) represent, in map form, the total potential BA loss resulting from the application of the 2006 National Insect and Disease Risk Map (NIDRM) Project. Specifically, it is the compilation of all BA losses resulting from running all 188 models of agent/host interactions which result in mortality.

The 2006 National Insect and Disease Risk Map (NIDRM) Project integrates 188 individual risk models constructed within a common, consistent framework that accounts for regional variations in current and future forest health. The 2006 risk assessment, conducted within the contiguous United States and Alaska, provides a consistent, repeatable, transparent process through which interactive spatial and temporal risk assessments can be conducted at various scales to aid in the allocation of resources for forest health management. This modeling process is intended to increase the utilization of forest health risk maps within and outside the National Forest System and encourage development of future risk maps. NIDRM...

This dataset combines the sensitive soils datasets for the Southern Rockies Landscape Conservation Cooperative, the projected future vegetation and the simulated historic potential natural vegetation, created using the MC2 dynamic global vegetation model. Colors represent unique combinations of vegetation change and the number of sensitive soil factors present in a given area.

This map is derived from pct_baloss, the comprehensive version of the final results of the 2006 National Insect and Disease Risk Map (NIDRM) Project. Specifically, its pixel values range from 0 to 100 percent, representing the predicted percent of basal area loss over the next 15 years due to insects and diseases.

Two maps (PCT_BALOSS - the ArcInfo Grid referenced to this metadata - and PCT_BALOSS_AK - see accompanying Grid and its associated metadata) represent, in map form, the comprehensive version of the final results of the 2006 National Insect and Disease Risk Map (NIDRM) Project. Specifically, their pixel values range from 0 to 100 percent, representing the predicted percent of basal area loss over the next 15 years due to insects and diseases.

This dataset combines the sensitive soils datasets for the Southern Rockies Landscape Conservation Cooperative, the projected future vegetation and the simulated historic potential natural vegetation, created using the MC2 dynamic global vegetation model. Colors represent unique combinations of vegetation change and the number of sensitive soil factors present in a given area.

The 2006 National Insect and Disease Risk Map (NIDRM) Project integrates 188 individual risk models constructed within a common, consistent framework that accounts for regional variations in current and future forest health. The 2006 risk assessment, conducted within the contiguous United States and Alaska, provides a consistent, repeatable, transparent process through which interactive spatial and temporal risk assessments can be conducted at various scales to aid in the allocation of resources for forest health management. This modeling process is intended to increase the utilization of forest health risk maps within and outside the National Forest System and encourage development of future risk maps. NIDRM...

The 2006 National Insect and Disease Risk Map (NIDRM) Project integrates 188 individual risk models constructed within a common, consistent framework that accounts for regional variations in current and future forest health. The 2006 risk assessment, conducted within the contiguous United States and Alaska, provides a consistent, repeatable, transparent process through which interactive spatial and temporal risk assessments can be conducted at various scales to aid in the allocation of resources for forest health management. This modeling process is intended to increase the utilization of forest health risk maps within and outside the National Forest System and encourage development of future risk maps. NIDRM...

The 2006 National Insect and Disease Risk Map (NIDRM) Project integrates 188 individual risk models constructed within a common, consistent framework that accounts for regional variations in current and future forest health. The 2006 risk assessment, conducted within the contiguous United States and Alaska, provides a consistent, repeatable, transparent process through which interactive spatial and temporal risk assessments can be conducted at various scales to aid in the allocation of resources for forest health management. This modeling process is intended to increase the utilization of forest health risk maps within and outside the National Forest System and encourage development of future risk maps. NIDRM...

This dataset combines the sensitive soils datasets for the Southern Rockies Landscape Conservation Cooperative, the projected future vegetation and the simulated historic potential natural vegetation, created using the MC2 dynamic global vegetation model. Colors represent unique combinations of vegetation change and the number of sensitive soil factors present in a given area.
This dataset combines the sensitive soils datasets for the Southern Rockies Landscape Conservation Cooperative, the projected future vegetation and the simulated historic potential natural vegetation, created using the MC2 dynamic global vegetation model. Colors represent unique combinations of vegetation change and the number of sensitive soil factors present in a given area.

This dataset shows the number of vulnerability factors affecting the landscape in the norther portion of the Southern Rockies Conservation Cooperative. There can be from 0 to 9 factors (low available soil water capacity, high calcium carbonates, high gypsum content, low pH, high pH, shallow depth, high wind erodibility, high water erodibility, and high sodicity).
|

|
