Filters: Tags: Wake County (X)
151 results (47ms)|
Filters
Date Range
Types Contacts
Categories Tag Types Tag Schemes |
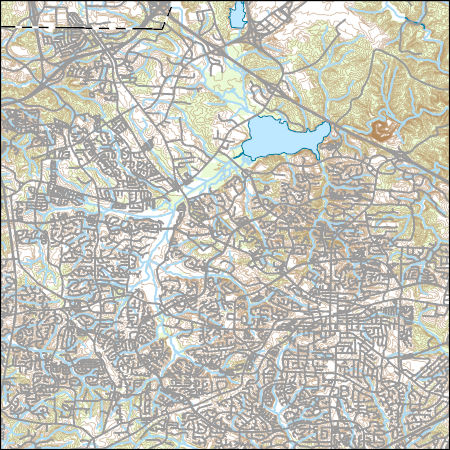
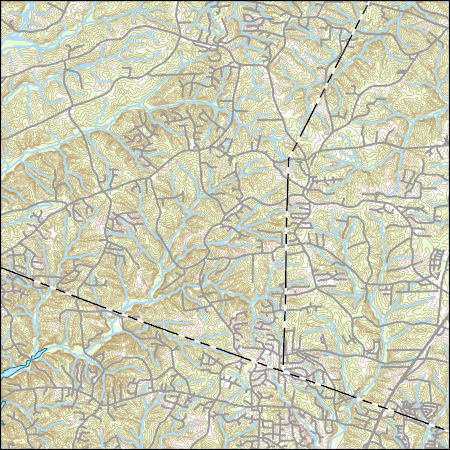
Layers of geospatial data include contours, boundaries, land cover, hydrography, roads, transportation, geographic names, structures, and other selected map features.
Types: Citation;
Tags: 7.5 x 7.5 minute,
7_5_Min,
Combined Vector,
Combined Vector,
Combined Vector,
Layers of geospatial data include contours, boundaries, land cover, hydrography, roads, transportation, geographic names, structures, and other selected map features.
Types: Citation;
Tags: 7.5 x 7.5 minute,
7_5_Min,
Combined Vector,
Combined Vector,
Combined Vector,
Layers of geospatial data include contours, boundaries, land cover, hydrography, roads, transportation, geographic names, structures, and other selected map features.
Layers of geospatial data include contours, boundaries, land cover, hydrography, roads, transportation, geographic names, structures, and other selected map features.
This U.S. Geological Survey Data Release contains the associated data described in the Scientific Investigations Report, "Trends in water quality of selected streams and reservoirs used for water supply in the Triangle area of North Carolina, 1989-2013". Since 1989, the U.S. Geological Survey and a consortium of local governments have tracked water-quality conditions and trends in the water-supply reservoirs and streams in the Triangle area of North Carolina located within the upper Cape Fear and Neuse River Basins. Temporal trends in water-quality were analyzed for thirteen stream and eight reservoir sites. Seventeen water-quality parameters and constituents were examined at these sites.
The dataset contains the analytical results for quality-control samples collected during the surface-water sampling for the Triangle Area Water Supply Monitoring Project. The data are sampling-equipment blanks, sampling-vehicle (ambient) blanks, and field blanks collected during October 2011 through September 2013. Several study sites contained in this dataset were sampled for other USGS projects during the same time frame. Unless the quality-control samples at these sites were collected in conjunction with the Triangle Area Water Supply Monitoring Project, the data for other projects are not included in the dataset.
The dataset contains the environmental data collected for the Triangle Area Water Supply Monitoring Project. The data are from the samples collected during routine and storm-runoff sampling events during October 2017 through September 2019. Several study sites contained in this dataset were sampled for other USGS projects during the same time frame. Unless the samples at these sites were collected in conjunction with the Triangle Area Water Supply Monitoring Project, the data for other projects at these sites are not included in this dataset.
Temperature data were collected from ~40 portable data (temperature) loggers and two weather stations located in central North Carolina, USA during August 2015. In addition to temperature, solar radiation and wind speed data were recorded at one of the sites to estimate the effects of these climate variables on sensor bias.
Categories: Data;
Types: Citation;
Tags: Climatology,
Durham County,
Ecology,
Land Use Change,
Southeast CASC,
Layered geospatial PDF 7.5 Minute Quadrangle Map. Layers of geospatial data include orthoimagery, roads, grids, geographic names, elevation contours, hydrography, and other selected map features. This map is derived from GIS (geospatial information system) data. It represents a repackaging of GIS data in traditional map form, not creation of new information. The geospatial data in this map are from selected National Map data holdings and other government sources.
Layered geospatial PDF 7.5 Minute Quadrangle Map. Layers of geospatial data include orthoimagery, roads, grids, geographic names, elevation contours, hydrography, and other selected map features. This map is derived from GIS (geospatial information system) data. It represents a repackaging of GIS data in traditional map form, not creation of new information. The geospatial data in this map are from selected National Map data holdings and other government sources.

Layers of geospatial data include contours, boundaries, land cover, hydrography, roads, transportation, geographic names, structures, and other selected map features.
Types: Citation;
Tags: 7.5 x 7.5 minute,
7_5_Min,
Combined Vector,
Combined Vector,
Combined Vector,
Layers of geospatial data include contours, boundaries, land cover, hydrography, roads, transportation, geographic names, structures, and other selected map features.
Types: Citation;
Tags: 7.5 x 7.5 minute,
7_5_Min,
Combined Vector,
Combined Vector,
Combined Vector,
Layers of geospatial data include contours, boundaries, land cover, hydrography, roads, transportation, geographic names, structures, and other selected map features.
Types: Citation;
Tags: 7.5 x 7.5 minute,
7_5_Min,
Combined Vector,
Combined Vector,
Combined Vector,
Layers of geospatial data include contours, boundaries, land cover, hydrography, roads, transportation, geographic names, structures, and other selected map features.
Layers of geospatial data include contours, boundaries, land cover, hydrography, roads, transportation, geographic names, structures, and other selected map features.
Types: Citation;
Tags: 7.5 x 7.5 minute,
7_5_Min,
Combined Vector,
Combined Vector,
Combined Vector,
These datasets contain information used to compile the report (USGS OFR 2021-1020). It contains water-quality data, analytical results of field blanks, and analytical results for environmental and replicate sample sets for surface-water samples collected during water years 2018 and 2019 for the Triangle Area Water Supply Monitoring Program (TAWSMP).
These datasets contain information used to compile the report (USGS OFR 2016-1137). It contains water-quality data, analytical results of field blanks, and analytical results for environmental and replicate sample sets for surface-water samples collected during water years 2012 and 2013 for the Triangle Area Water Supply Monitoring Program (TAWSMP). The water-quality data contained in appendix 1 are field paramters and the analytical results for the constituents analyzed for the project. Appendix 2 contains the results of the field blanks, and the results for the environmental and replicate sample sets are presented in appendix 3.
Types: Citation;
Tags: Chatham County,
Durham County,
North Carolina,
Orange County,
USGS Science Data Catalog (SDC),
The dataset contains the analytical results for environmental and quality-control replicate sample sets and the computed relative percent differences (RPD) greater than 25 percent for the data collected during the surface-water sampling for the Triangle Area Water Supply Monitoring Project. The data are from samples collected during October 2013 through September 2015. Several study sites contained in this dataset were sampled for other USGS projects during the same time frame. Unless the samples at these sites were collected in conjunction with the Triangle Area Water Supply Monitoring Project, the data for other projects are not included in the dataset.
This U.S. Geological Survey Data Release contains the associated data described in the Scientific Investigations Report, "Trends in water quality of selected streams and reservoirs used for water supply in the Triangle area of North Carolina, 1989-2013". Since 1989, the U.S. Geological Survey and a consortium of local governments have tracked water-quality conditions and trends in the water-supply reservoirs and streams in the Triangle area of North Carolina located within the upper Cape Fear and Neuse River Basins. Temporal trends in water-quality were analyzed for thirteen stream and eight reservoir sites. Seventeen water-quality parameters and constituents were examined at these sites
The dataset contains the analytical results for environmental and quality-control replicate sample sets and the computed relative percent differences (RPD) greater than 25 percent for the data collected during the surface-water sampling for the Triangle Area Water Supply Monitoring Project. The data are from samples collected during October 2017 through September 2019. Several study sites contained in this dataset were sampled for other USGS projects during the same time frame. Unless the samples at these sites were collected in conjunction with the Triangle Area Water Supply Monitoring Project, the data for other projects are not included in the dataset.
|

|
