Filters: Tags: Wayne County (X)
1,163 results (60ms)|
Filters
Date Range
Extensions Types
Contacts
Categories Tag Types
|
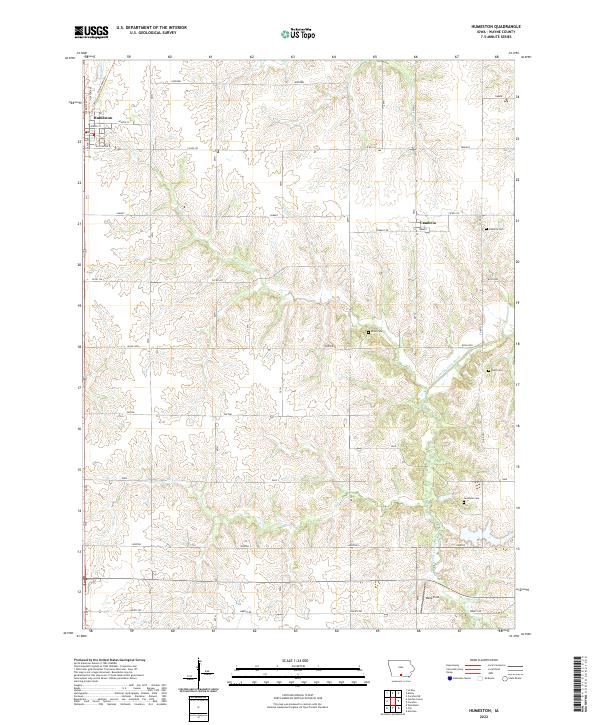
Layered geospatial PDF 7.5 Minute Quadrangle Map. Layers of geospatial data include orthoimagery, roads, grids, geographic names, elevation contours, hydrography, and other selected map features. This map is derived from GIS (geospatial information system) data. It represents a repackaging of GIS data in traditional map form, not creation of new information. The geospatial data in this map are from selected National Map data holdings and other government sources.
Layered geospatial PDF 7.5 Minute Quadrangle Map. Layers of geospatial data include orthoimagery, roads, grids, geographic names, elevation contours, hydrography, and other selected map features. This map is derived from GIS (geospatial information system) data. It represents a repackaging of GIS data in traditional map form, not creation of new information. The geospatial data in this map are from selected National Map data holdings and other government sources.
Groundwater quality data for 472 domestic well-water samples were retrieved from the USGS National Water Information System (NWIS) database and combined with descriptive information on the sampled well locations. The NWIS data for a sample, collected on the selected date, were averaged into a single record (one per well), and rounded according to USGS protocols. For evaluation and reporting, the water-quality data were further combined with physical attributes and classified by lithology, topographic position, physiographic province, region, redox, and pH (as standalone matrix, one row per well). A second data matrix file incorporating minimum reporting levels for censored and low-reported values (set to 0.99X highest...
Categories: Data;
Tags: Bradford County,
Clinton County,
Geochemistry,
Groundwater Quality,
Hydrology,
This polygon feature class represents vegetation communities mapped at Canyonlands National Park. The polygons were generated using guidelines set by the Standardized National Vegetation Classification System (October 1995). A combination of methods were used to map Canyonlands. The USGS used e-Cognition software to create segments. The segments created were then looked at and extensively edited by the vegetation mappers. Some mapping was done on screen, using the 2002 imagery. Hard copy 9X9 photography was used for photo interpretation. Traditional image interpretation cues were used to develop the polygons, such as shape, size, pattern, tone, texture, color, and shadow. Additional data layers were used in aiding...
Layered geospatial PDF 7.5 Minute Quadrangle Map. Layers of geospatial data include orthoimagery, roads, grids, geographic names, elevation contours, hydrography, and other selected map features. This map is derived from GIS (geospatial information system) data. It represents a repackaging of GIS data in traditional map form, not creation of new information. The geospatial data in this map are from selected National Map data holdings and other government sources.
Layered geospatial PDF 7.5 Minute Quadrangle Map. Layers of geospatial data include orthoimagery, roads, grids, geographic names, elevation contours, hydrography, and other selected map features. This map is derived from GIS (geospatial information system) data. It represents a repackaging of GIS data in traditional map form, not creation of new information. The geospatial data in this map are from selected National Map data holdings and other government sources.
Layered geospatial PDF 7.5 Minute Quadrangle Map. Layers of geospatial data include orthoimagery, roads, grids, geographic names, elevation contours, hydrography, and other selected map features. This map is derived from GIS (geospatial information system) data. It represents a repackaging of GIS data in traditional map form, not creation of new information. The geospatial data in this map are from selected National Map data holdings and other government sources.
Layered geospatial PDF 7.5 Minute Quadrangle Map. Layers of geospatial data include orthoimagery, roads, grids, geographic names, elevation contours, hydrography, and other selected map features. This map is derived from GIS (geospatial information system) data. It represents a repackaging of GIS data in traditional map form, not creation of new information. The geospatial data in this map are from selected National Map data holdings and other government sources.
Layered geospatial PDF 7.5 Minute Quadrangle Map. Layers of geospatial data include orthoimagery, roads, grids, geographic names, elevation contours, hydrography, and other selected map features. This map is derived from GIS (geospatial information system) data. It represents a repackaging of GIS data in traditional map form, not creation of new information. The geospatial data in this map are from selected National Map data holdings and other government sources.
Layered geospatial PDF 7.5 Minute Quadrangle Map. Layers of geospatial data include orthoimagery, roads, grids, geographic names, elevation contours, hydrography, and other selected map features. This map is derived from GIS (geospatial information system) data. It represents a repackaging of GIS data in traditional map form, not creation of new information. The geospatial data in this map are from selected National Map data holdings and other government sources.
Layered geospatial PDF 7.5 Minute Quadrangle Map. Layers of geospatial data include orthoimagery, roads, grids, geographic names, elevation contours, hydrography, and other selected map features. This map is derived from GIS (geospatial information system) data. It represents a repackaging of GIS data in traditional map form, not creation of new information. The geospatial data in this map are from selected National Map data holdings and other government sources.
Introduction Detailed mapping of the glacial aquifer within the buried Fairport-Lyons bedrock channel in southern Wayne County, N.Y. is the latest study in the cooperative Detailed Aquifer Mapping Program between the U.S. Geological Survey (USGS) and the New York State Department of Environmental Conservation (NYSDEC). The aim of the program is to map the extent of glacial aquifers in New York State at a scale of 1:24,000. This information is used by NYSDEC Division of Water and others for delineation of groundwater contributing areas, assessing potential threats to aquifers from both point and non-point sources of pollution, responding to contamination from spills or leaks from underground storage facilities,...
Categories: Data,
Project;
Types: Downloadable,
Map Service,
OGC WFS Layer,
OGC WMS Layer,
Shapefile;
Tags: Aquifer Mapping,
Aquifer Mapping,
Aquifer Mapping,
Cooperative Water Program,
Fairport-Lyons Channel Aquifer,
Layers of geospatial data include contours, boundaries, land cover, hydrography, roads, transportation, geographic names, structures, and other selected map features.
Types: Citation;
Tags: 7.5 x 7.5 minute,
7.5 x 7.5 minute,
Appanoose County,
Combined Vector,
Combined Vector,
Layers of geospatial data include contours, boundaries, land cover, hydrography, roads, transportation, geographic names, structures, and other selected map features.
Types: Citation;
Tags: 7.5 x 7.5 minute,
7.5 x 7.5 minute,
Combined Vector,
Combined Vector,
Combined Vector,
Layered geospatial PDF 7.5 Minute Quadrangle Map. Layers of geospatial data include orthoimagery, roads, grids, geographic names, elevation contours, hydrography, and other selected map features. This map is derived from GIS (geospatial information system) data. It represents a repackaging of GIS data in traditional map form, not creation of new information. The geospatial data in this map are from selected National Map data holdings and other government sources.
Layered geospatial PDF 7.5 Minute Quadrangle Map. Layers of geospatial data include orthoimagery, roads, grids, geographic names, elevation contours, hydrography, and other selected map features. This map is derived from GIS (geospatial information system) data. It represents a repackaging of GIS data in traditional map form, not creation of new information. The geospatial data in this map are from selected National Map data holdings and other government sources.
From April through September of 2018, water-quality data were collected at 35 locations from select tributaries, embayments, and nearshore lake locations along New York's portion of Lake Ontario in support of the 2018 Cooperative Science and Monitoring Initiative, the Great Lakes Restoration Initiative, and the Lakewide Action Management Plan. These data include environmental, replicate, and blank samples of nutrients, suspended solids, sodium, and chloride, as well as field measurements of physical parameters (temperature, specific conductance, dissolved oxygen, pH, turbidity, phycocyanin relative fluorescence, chlorophyll relative fluorescence, photosynthetically active radiation, and phycocyanin:cholorphyll...
Categories: Data;
Types: Downloadable,
Map Service,
OGC WFS Layer,
OGC WMS Layer,
Shapefile;
Tags: Cayuga County,
Hydrology,
Jefferson County,
Lake Ontario,
Monroe County,
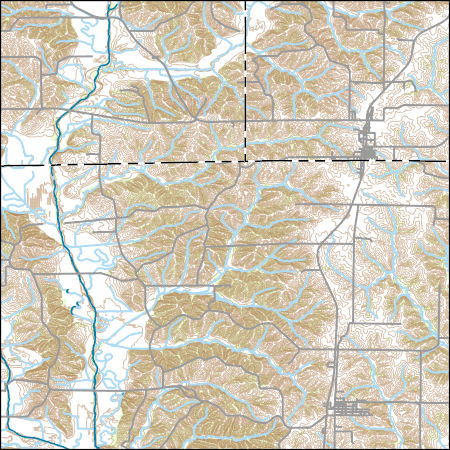
Layers of geospatial data include contours, boundaries, land cover, hydrography, roads, transportation, geographic names, structures, and other selected map features.
Types: Citation;
Tags: 7.5 x 7.5 minute,
7.5 x 7.5 minute,
Combined Vector,
Combined Vector,
Combined Vector,
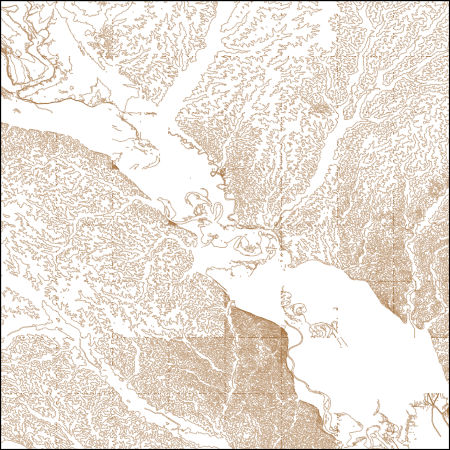
These vector contour lines are derived from the 3D Elevation Program using automated and semi-automated processes. They were created to support 1:24,000-scale CONUS and Hawaii, 1:25,000-scale Alaska, and 1:20,000-scale Puerto Rico / US Virgin Island topographic map products, but are also published in this GIS vector format. Contour intervals are assigned by 7.5-minute quadrangle, so this vector dataset is not visually seamless across quadrangle boundaries. The vector lines have elevation attributes (in feet above mean sea level on NAVD88), but this dataset does not carry line symbols or annotation.
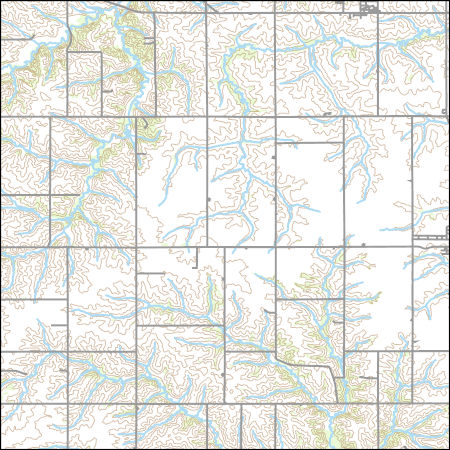
Layers of geospatial data include contours, boundaries, land cover, hydrography, roads, transportation, geographic names, structures, and other selected map features.
Types: Citation;
Tags: 7.5 x 7.5 minute,
7.5 x 7.5 minute,
Combined Vector,
Combined Vector,
Combined Vector,
|

|
