Filters: Tags: Wisconsin (X) > Types: Citation (X)
2,546 results (128ms)|
Filters
Date Range
Extensions
Types Contacts
Categories Tag Types
|
High radium (Ra) concentrations in potable portions of the Cambrian-Ordovician (C-O) aquifer system were investigated using water-quality data and environmental tracers ( 3H, 3Hetrit, SF6 , 14C and 4Herad) of groundwater age from 80 public-supply wells (PSWs). Groundwater ages were estimated by calibration of tracers to lumped parameter models and ranged from modern (1 Myr) in the most downgradient, confined portions of the potable system. More than 80 and 40 percent of mean groundwater ages were older than 1000 and 50,000 yr, respectively. Anoxic, Fe-reducing conditions and increased mineralization develop with time in the aquifer system and mobilize Ra into solution resulting in the frequent occurrence of combined...
Layers of geospatial data include contours, boundaries, land cover, hydrography, roads, transportation, geographic names, structures, and other selected map features.
Types: Citation;
Tags: 7.5 x 7.5 minute,
7.5 x 7.5 minute,
Boone County,
Combined Vector,
Combined Vector,
The U. S. Geological Survey (USGS) makes long-term seismic hazard forecasts that are used in building codes. The hazard models usually consider only natural seismicity; non-tectonic (man-made) earthquakes are excluded because they are transitory or too small. In the past decade, however, thousands of earthquakes related to underground fluid injection have occurred in the central and eastern U.S. (CEUS), and some have caused damage. In response, the USGS is now also making short-term forecasts that account for the hazard from these induced earthquakes. A uniform earthquake catalog is assembled by combining and winnowing pre-existing source catalogs. Seismicity statistics are analyzed to develop recurrence models,...
Layers of geospatial data include contours, boundaries, land cover, hydrography, roads, transportation, geographic names, structures, and other selected map features.
Types: Citation;
Tags: 7.5 x 7.5 minute,
7.5 x 7.5 minute,
Combined Vector,
Combined Vector,
Combined Vector,
Layers of geospatial data include contours, boundaries, land cover, hydrography, roads, transportation, geographic names, structures, and other selected map features.
Types: Citation;
Tags: 7.5 x 7.5 minute,
7_5_Min,
Combined Vector,
Combined Vector,
Combined Vector,
Layers of geospatial data include contours, boundaries, land cover, hydrography, roads, transportation, geographic names, structures, and other selected map features.
Types: Citation;
Tags: 7.5 x 7.5 minute,
7_5_Min,
Combined Vector,
Combined Vector,
Combined Vector,
Layers of geospatial data include contours, boundaries, land cover, hydrography, roads, transportation, geographic names, structures, and other selected map features.
Types: Citation;
Tags: 7.5 x 7.5 minute,
7_5_Min,
Combined Vector,
Combined Vector,
Combined Vector,
Layers of geospatial data include contours, boundaries, land cover, hydrography, roads, transportation, geographic names, structures, and other selected map features.
Types: Citation;
Tags: 7.5 x 7.5 minute,
7_5_Min,
Combined Vector,
Combined Vector,
Combined Vector,
Layers of geospatial data include contours, boundaries, land cover, hydrography, roads, transportation, geographic names, structures, and other selected map features.
Types: Citation;
Tags: 7.5 x 7.5 minute,
7_5_Min,
Combined Vector,
Combined Vector,
Combined Vector,
Layers of geospatial data include contours, boundaries, land cover, hydrography, roads, transportation, geographic names, structures, and other selected map features.
Types: Citation;
Tags: 7.5 x 7.5 minute,
7_5_Min,
Combined Vector,
Combined Vector,
Combined Vector,
Layers of geospatial data include contours, boundaries, land cover, hydrography, roads, transportation, geographic names, structures, and other selected map features.
Types: Citation;
Tags: 7.5 x 7.5 minute,
7_5_Min,
Combined Vector,
Combined Vector,
Combined Vector,
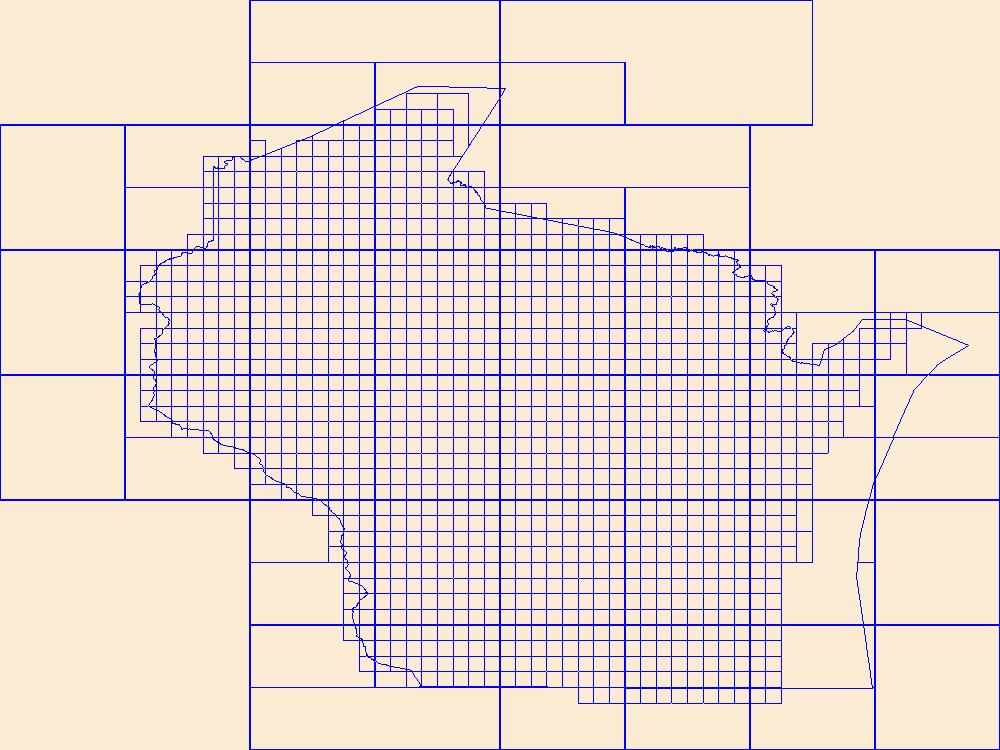
This data represents the map extent for current and historical USGS topographic maps for the United States and Territories, including 1 X 2 Degree, 1 X 1 Degree, 30 X 60 Minute, 15 X 15 Minute, 7.5 X 7.5 Minute, and 3.75 X 3.75 Minute. The grid was generated using ESRI ArcInfo GIS software.
Layers of geospatial data include contours, boundaries, land cover, hydrography, roads, transportation, geographic names, structures, and other selected map features.
Types: Citation;
Tags: 7.5 x 7.5 minute,
7_5_Min,
Combined Vector,
Combined Vector,
Combined Vector,
Layers of geospatial data include contours, boundaries, land cover, hydrography, roads, transportation, geographic names, structures, and other selected map features.
Types: Citation;
Tags: 7.5 x 7.5 minute,
7_5_Min,
Combined Vector,
Combined Vector,
Combined Vector,
Layers of geospatial data include contours, boundaries, land cover, hydrography, roads, transportation, geographic names, structures, and other selected map features.
Types: Citation;
Tags: 7.5 x 7.5 minute,
7_5_Min,
Combined Vector,
Combined Vector,
Combined Vector,
This EnviroAtlas web service supports research and online mapping activities related to EnviroAtlas (https://www.epa.gov/enviroatlas). The Clean and Plentiful Water category in this web service includes layers illustrating the ecosystems and natural resources that filter and regulate water, the need or demand for clean and plentiful water, the impacts associated with water quality, and factors that place stress on water quality and supply. EnviroAtlas allows the user to interact with a web-based, easy-to-use, mapping application to view and analyze multiple ecosystem services for the conterminous United States. Additional descriptive information about each attribute in this web service is located within each web...
Synopsis: This article outlines how wetlands can significantly reduce flooding in the Upper Mississippi watershed. The authors first provide a historical context by estimating the original and lost wetland storage capacities of the Upper Mississippi and Missouri River Basins. Historically, about 10% of the basin would have been classified as wetland in 1780. By 1980, wetland acreage had been reduced to only 4% of the basin, representing about 26 million acres of wetlands eliminated since 1780. The area of wetland restoration required to reduce the risk of future flooding adequately was estimated based on the total amount of excess floodwater beyond bank-full discharge that passed through the City of St. Louis during...
Categories: Publication;
Types: Citation,
Map Service,
OGC WFS Layer,
OGC WMS Layer,
OGC WMS Service;
Tags: Illinois,
Iowa,
Kansas,
Minnesota,
Missouri,
Layers of geospatial data include contours, boundaries, land cover, hydrography, roads, transportation, geographic names, structures, and other selected map features.
Types: Citation;
Tags: 7.5 x 7.5 minute,
7.5 x 7.5 minute,
Buffalo County,
Combined Vector,
Combined Vector,
Layers of geospatial data include contours, boundaries, land cover, hydrography, roads, transportation, geographic names, structures, and other selected map features.
Types: Citation;
Tags: 7.5 x 7.5 minute,
7.5 x 7.5 minute,
Buffalo County,
Combined Vector,
Combined Vector,
Layers of geospatial data include contours, boundaries, land cover, hydrography, roads, transportation, geographic names, structures, and other selected map features.
Types: Citation;
Tags: 7.5 x 7.5 minute,
7.5 x 7.5 minute,
Combined Vector,
Combined Vector,
Combined Vector,
|

|
