Filters: Tags: arctic (X)
378 results (7ms)|
Filters
|
This collection of GIS layers was prepared for the report Alaska Arctic Marine Fish Ecology Catalog (U.S. Geological Survey Scientific Investigations Report 2016–5038). The layers display geographic distribution and sampling locations for Arctic marine fish species in the region of United States sectors of the Chukchi and Beaufort Seas. Certain diadromous species (for example, Pacific salmon, char, and whitefishes) are treated as marine fishes (McDowall, 1987) because much of their life cycle is in marine and brackish environments. This synthesis of information is meant to provide current information and understanding of this fauna and its relative vulnerability to changing Arctic conditions. There are 104 species...

The National Environmental Satellite, Data, and Information Service (NESDIS), part of the National Oceanic and Atmospheric Administration (NOAA), has an extensive history of monitoring snow and ice coverage. Accurate monitoring of global snow and ice cover is a key component in the study of climate and global change as well as daily weather forecasting. By inspecting environmental satellite imagery, analysts from the Satellite Analysis Branch (SAB) at the Office of Satellite Data Processing and Distribution (OSDPD), Satellite Services Division (SSD), created a Northern Hemisphere snow and ice map from November 1966 until the National Ice Center (NIC) took over production in 2008. Initially, the product was produced...

Vector line dataset displaying the extent of sea ice and subsea permafrost in the northern hemisphere. This is a companion dataset to the Circum-Arctic Map of Permafrost and Ground Ice Conditions .
The Multisensor Analyzed Sea Ice Extent – Northern Hemisphere (MASIE-NH) products provide measurements of daily sea ice extent and sea ice edge boundary for the Northern Hemisphere and 16 Arctic regions in a polar stereographic projection. Products include an ASCII text file of sea ice extent values in square km over the entire Northern Hemisphere with 16 separate Arctic regions identified, time series plots of the 16 regions, and image files that visually show where the sea ice is. The MASIE-NH imagery are provided at a nominal 4 km resolution. The input data comes from the 4 km Interactive Multisensor Snow and Ice Mapping System (IMS) snow and ice product produced by the National Ice Center (NIC). NIC utilizes...
Region(s) of distribution of Hamecon (Artediellus scaber) Knipowitsch, 1907 in the Arctic as digitized for U.S. Geological Survey Scientific Investigations Report 2016-5038. For details on the project and purpose, see the report at https://doi.org/10.3133/sir20165038. Complete metadata for the collection of species datasets is in the metadata document "Dataset_for_Alaska_Marine_Fish_Ecology_Catalog.xml" at https://doi.org/10.5066/F7M61HD7. Source(s) for this digitized data layer are listed in the metadata Process Steps section. Note that the original source may show an extended area; some datasets were limited to the published map boundary. Distributions of marine fishes are shown in adjacent Arctic seas where reliable...
Categories: Data;
Types: Citation,
Downloadable,
Map Service,
OGC WFS Layer,
OGC WMS Layer,
Shapefile;
Tags: Alaska,
Arctic,
Arctic,
Artediellus scaber,
Beaufort Sea,
Region(s) of distribution of Saffron Cod (Eleginus gracilis) (Tilesius, 1810) in the Arctic as digitized for U.S. Geological Survey Scientific Investigations Report 2016-5038. For details on the project and purpose, see the report at https://doi.org/10.3133/sir20165038. Complete metadata for the collection of species datasets is in the metadata document "Dataset_for_Alaska_Marine_Fish_Ecology_Catalog.xml" at https://doi.org/10.5066/F7M61HD7. Source(s) for this digitized data layer are listed in the metadata Process Steps section. Note that the original source may show an extended area; some datasets were limited to the published map boundary. Distributions of marine fishes are shown in adjacent Arctic seas where...
Categories: Data;
Types: Citation,
Downloadable,
Map Service,
OGC WFS Layer,
OGC WMS Layer,
Shapefile;
Tags: (Tilesius, 1810),
Alaska,
Arctic,
Arctic,
Beaufort Sea,
Region(s) of distribution of Fourhorn Poacher (Hypsagonus quadricornis) (Valenciennes, 1829) in the Arctic as digitized for U.S. Geological Survey Scientific Investigations Report 2016-5038. For details on the project and purpose, see the report at https://doi.org/10.3133/sir20165038. Complete metadata for the collection of species datasets is in the metadata document "Dataset_for_Alaska_Marine_Fish_Ecology_Catalog.xml" at https://doi.org/10.5066/F7M61HD7. Source(s) for this digitized data layer are listed in the metadata Process Steps section. Note that the original source may show an extended area; some datasets were limited to the published map boundary. Distributions of marine fishes are shown in adjacent Arctic...
Categories: Data;
Types: Citation,
Downloadable,
Map Service,
OGC WFS Layer,
OGC WMS Layer,
Shapefile;
Tags: (Valenciennes, 1829),
Alaska,
Arctic,
Arctic,
Beaufort Sea,
Marine Arctic polygon distribution of Fourhorn Sculpin (Myoxocephalus quadricornis) (Linnaeus, 1758)
Region(s) of distribution of Fourhorn Sculpin (Myoxocephalus quadricornis) (Linnaeus, 1758) in the Arctic as digitized for U.S. Geological Survey Scientific Investigations Report 2016-5038. For details on the project and purpose, see the report at https://doi.org/10.3133/sir20165038. Complete metadata for the collection of species datasets is in the metadata document "Dataset_for_Alaska_Marine_Fish_Ecology_Catalog.xml" at https://doi.org/10.5066/F7M61HD7. Source(s) for this digitized data layer are listed in the metadata Process Steps section. Note that the original source may show an extended area; some datasets were limited to the published map boundary. Distributions of marine fishes are shown in adjacent Arctic...
Categories: Data;
Types: Citation,
Downloadable,
Map Service,
OGC WFS Layer,
OGC WMS Layer,
Shapefile;
Tags: (Linnaeus, 1758),
Alaska,
Arctic,
Arctic,
Beaufort Sea,
Region(s) of distribution of Eyeshade Sculpin (Nautichthys pribilovius) (Jordan & Gilbert, 1898) in the Arctic as digitized for U.S. Geological Survey Scientific Investigations Report 2016-5038. For details on the project and purpose, see the report at https://doi.org/10.3133/sir20165038. Complete metadata for the collection of species datasets is in the metadata document "Dataset_for_Alaska_Marine_Fish_Ecology_Catalog.xml" at https://doi.org/10.5066/F7M61HD7. Source(s) for this digitized data layer are listed in the metadata Process Steps section. Note that the original source may show an extended area; some datasets were limited to the published map boundary. Distributions of marine fishes are shown in adjacent...
Categories: Data;
Types: Citation,
Downloadable,
Map Service,
OGC WFS Layer,
OGC WMS Layer,
Shapefile;
Tags: (Jordan & Gilbert, 1898),
Alaska,
Arctic,
Arctic,
Beaufort Sea,
Region(s) of distribution of Chinook Salmon (Oncorhynchus tshawytscha) (Walbaum, 1792) in the Arctic as digitized for U.S. Geological Survey Scientific Investigations Report 2016-5038. For details on the project and purpose, see the report at https://doi.org/10.3133/sir20165038. Complete metadata for the collection of species datasets is in the metadata document "Dataset_for_Alaska_Marine_Fish_Ecology_Catalog.xml" at https://doi.org/10.5066/F7M61HD7. Source(s) for this digitized data layer are listed in the metadata Process Steps section. Note that the original source may show an extended area; some datasets were limited to the published map boundary. Distributions of marine fishes are shown in adjacent Arctic seas...
Categories: Data;
Types: Citation,
Downloadable,
Map Service,
OGC WFS Layer,
OGC WMS Layer,
Shapefile;
Tags: (Walbaum, 1792),
Alaska,
Arctic,
Arctic,
Beaufort Sea,
Region(s) of distribution of Inconnu (Stenodus leucichthys) (Güldenstadt, 1772) in the Arctic as digitized for U.S. Geological Survey Scientific Investigations Report 2016-5038. For details on the project and purpose, see the report at https://doi.org/10.3133/sir20165038. Complete metadata for the collection of species datasets is in the metadata document "Dataset_for_Alaska_Marine_Fish_Ecology_Catalog.xml" at https://doi.org/10.5066/F7M61HD7. Source(s) for this digitized data layer are listed in the metadata Process Steps section. Note that the original source may show an extended area; some datasets were limited to the published map boundary. Distributions of marine fishes are shown in adjacent Arctic seas where...
Categories: Data;
Types: Citation,
Downloadable,
Map Service,
OGC WFS Layer,
OGC WMS Layer,
Shapefile;
Tags: (Güldenstadt, 1772),
Alaska,
Arctic,
Arctic,
Beaufort Sea,

The National Environmental Satellite, Data, and Information Service (NESDIS), part of the National Oceanic and Atmospheric Administration (NOAA), has an extensive history of monitoring snow and ice coverage. Accurate monitoring of global snow and ice cover is a key component in the study of climate and global change as well as daily weather forecasting. By inspecting environmental satellite imagery, analysts from the Satellite Analysis Branch (SAB) at the Office of Satellite Data Processing and Distribution (OSDPD), Satellite Services Division (SSD), created a Northern Hemisphere snow and ice map from November 1966 until the National Ice Center (NIC) took over production in 2008. Initially, the product was produced...
Abstract (from http://onlinelibrary.wiley.com/doi/10.1111/gcb.12875/abstract): Permafrost thaw can alter the soil environment through changes in soil moisture, frequently resulting in soil saturation, a shift to anaerobic decomposition, and changes in the plant community. These changes, along with thawing of previously frozen organic material, can alter the form and magnitude of greenhouse gas production from permafrost ecosystems. We synthesized existing methane (CH 4) and carbon dioxide (CO 2) production measurements from anaerobic incubations of boreal and tundra soils from the geographic permafrost region to evaluate large-scale controls of anaerobic CO 2 and CH 4 production and compare the relative importance...
Categories: Publication;
Types: Citation;
Tags: Alaska CASC,
Alaska CASC,
Glaciers and Permafrost,
Water, Coasts and Ice,
anaerobic incubation,
This dataset contains taxonomic information, counts, and lengths of macroinvertebrates collected from rivers in northwest Alaska using drift and kick nets during summer and fall 2015-2019.
This dataset consists of short-term (~32 years) shoreline change rates for the north coast of Alaska between the U.S. Canadian Border and the Hulahula River. Rate calculations were computed within a GIS using the Digital Shoreline Analysis System (DSAS) version 4.3, an ArcGIS extension developed by the U.S. Geological Survey. Short-term rates of shoreline change were calculated using a linear regression rate-of-change method based on available shoreline data between 1978 and 2010. A reference baseline was used as the originating point for the orthogonal transects cast by the DSAS software. The transects intersect each shoreline establishing measurement points, which are then used to calculate short-term rates.
Categories: Data;
Types: Citation,
Downloadable,
Map Service,
OGC WFS Layer,
OGC WMS Layer,
Shapefile;
Tags: ANWR,
Arctic,
Arctic National Wildlife Refuge,
Barter Island,
Beaufort Sea,
This dataset consists of short-term (~31 years) shoreline change rates for the north coast of Alaska between the Point Barrow and Icy Cape. Rate calculations were computed within a GIS using the Digital Shoreline Analysis System (DSAS) version 4.3, an ArcGIS extension developed by the U.S. Geological Survey. Short-term rates of shoreline change were calculated using a linear regression rate-of-change method based on available shoreline data between 1979 and 2010. A reference baseline was used as the originating point for the orthogonal transects cast by the DSAS software. The transects intersect each shoreline establishing measurement points, which are then used to calculate short-term rates.
Categories: Data;
Types: Citation,
Downloadable,
Map Service,
OGC WFS Layer,
OGC WMS Layer,
Shapefile;
Tags: Arctic,
Barrow,
CMGP,
Chukchi Sea,
Coastal and Marine Geology Program,
Alaska’s high-latitude, arctic landscape places it at the front lines of environmental change. Factors such as rising temperatures, altered precipitation patterns, and associated shifts in growing degree days, summer season length, extreme heat, and the timing of spring thaw and autumn frost are rapidly changing Alaska’s ecosystems and associated human systems. The ability of Alaska’s land managers and communities to predict these changes will profoundly affect their ability to adapt. The State of Alaska recognizes the scope and magnitude of these changes and has made it a priority to ensure anticipated change is incorporated into local and regional planning. This project will involve collaboration with agency...
Categories: Project;
Types: Map Service,
OGC WFS Layer,
OGC WMS Layer,
OGC WMS Service;
Tags: 2020,
Alaska,
Alaska CASC,
Arctic,
Arctic,
The RTK survey, using a Trimble unit, was conducted in August 2021 in the coastal plains region (1002 area) of the Arctic National Wildlife Refuge, as part of a landscape vulnerability assessment. A total of six transects are included in the data, including five research sites and one transect collected at the camp site. Mean horizontal precision was 0.006m, mean vertical precision was 0.011m.
Categories: Data;
Tags: Arctic,
Arctic National Wildlife Refuge,
Climatology,
Geography,
Geomorphology,
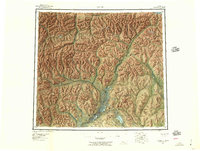
USGS Historical Quadrangle in GeoPDF.
Typed information accompanying negative: Waiting for the plane. The weather was cool but not cold, juding from the clothing. Similar to F-5 and F-6 (see links in Related Items below) Note: T-3 Photographs - Roll F B&W negatives - June paradrop, 1969. There were three paradrops during the summer of 1969 performed by Navy C-130 planes from Elmendorf Air Force Base in Fairbanks, Alaska. These are described in this website, http://www.firebirds.org/menu2/t3/t3_p02.htm On the receiving end of the paradrops on T-3, these days were the high points of the summer season. This roll documents the first paradrop, which occurred in late June on a cloudy day. The loads were delivered on target to the camp runway without...
|

|
