Filters: Tags: climate (X)
3,150 results (47ms)|
Filters
Date Range
Extensions Types Contacts
Categories Tag Types
|
This paper presents information relevant to rule-making for geopressuredgeothermal development on state-owned lands. The analysis is focused on those potential social and economic effects of resource development, if any, which may require special attention during the leasing and permitting process. For the most part, many of the expected socioeconomic impacts are not unique to geothermal development, but are already being felt by residents of the fairways because of ongoing developmental activities. The social and economic impacts likely to result from resource development depend upon characteristics specific to the site and surrounding social and economic systems. Specific impacts and their probability, magnitude,...
Stabilising the concentration of CO2 in the atmosphere at a level of 450 ppm in order to keep global temperature increase below 2 °C requires an ambitious climate policy. This study analyses the role of different technologies in the EU-27 with regard to efficiency improvements, fuel switching and energy saving measures under such a climate policy target. The analysis is carried out using the regionalised Pan-European TIMES energy system model, a technology oriented, linear optimisation model. Thereby limited resources and import potentials of various energy carriers, competition among different sectors and the country-specific differences in energy demand are taken into account. As a result, it turns out that the...
Categories: Publication;
Types: Citation;
Tags: Effects,
change,
climate,
climate change,
environment
This study analyzed the linkages between large-scale climate patterns and regional precipitation variability, in particular the interannual variation of seasonal precipitation in the Colorado River Basin. Two climate indices, the Southern Oscillation Index (SOI) and the Pacific Decadal Oscillation (PDO), were selected to represent climate patterns. Conceptual influence indices, which quantify the strength of linkages between climate patterns and precipitation variability, were developed based on the Standardized Precipitation Index (SPI). In turn, the spatial variability of the influence indices within the Colorado River Basin was examined for different combinations of SOI and PDO phases and lead times from zero...
Categories: Publication;
Types: Citation,
Journal Citation;
Tags: El Niño,
Journal of Hydrology,
La Niña,
climate,
precipitation
PRISM climate data for Wyoming. Data can be accessed through the Geospatial Data Gateway http://datagateway.nrcs.usda.gov/.
Categories: Data;
Types: Downloadable;
Tags: PRISM,
Precipitation,
Wyoming,
climate,
climatologyMeteorologyAtmosphere,

This dataset displays the Vector Ruggedness Measure (VRM) for the DRECP study site and surrounding 12 km buffer at 270m resolution. This dataset was originally derived at 30m resolution, using the 30m NED, and run with a 9x9 (270m) neighborhood size. The resulting VRM dataset was projected to CA Albers Equal Area NAD83 and resampled to 270m resolution to match the DRECP statistical species distribution models. The Vector Ruggedness Measure measures terrain ruggedness as the variation in three-dimensional orientation of grid cells within a neighborhood. Vector analysis is used to calculate the dispersion of vectors normal (orthogonal) to grid cells within the specified neighborhood. This method effectively captures...

Predicted probability of marten year-round occurrence derived from future (2076-2095) climate projections and vegetation simulations. Projected marten distribution was created with Maxent (Phillips et al. 2006) using marten detections (N = 102, spanning 1993 – 2011) and eight predictor variables: mean potential evapotranspiration, mean annual precipitation, mean fraction of vegetation carbon burned, mean forest carbon (g C m2), mean fraction of vegetation carbon in forest, understory index (fraction of grass vegetation carbon in forest), average maximum tree LAI, and modal vegetation class. Future climate drivers were generated using statistical downscaling (simple delta method) of general circulation model projections,...

Future winter (January – March) precipitation (mm; averaged over 2046-2065) at a 4 km x 4 km spatial resolution using future climate projections provided through CMIP3 (http://www-pcmdi.llnl.gov/ipcc/about_ipcc.php). Future climate drivers were generated using statistical downscaling (simple delta method) of general circulation model projections, in this case MIROC 3.2 medres (Hasumi and Emori 2004) under the A2 emission scenario (Naki?enovi? et al. 2000). The deltas (differences for temperatures and ratios for precipitation) were used to modify PRISM 4km historical baseline (Daly et al. 1994). Note: The MC1 model is described in data basin (http://databasin.org/climate-center/features/mc1-dynamic-global-vegetation-model)....

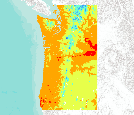
This map represents the percent change in total ecosystem carbon from 1971-2000 to 2070-2099, simulated by the model MC1 under the Hadley future climate projection and A2 anthropogenic emissions scenario. The average annual value of total ecosystem carbon for the respective 30-year periods decreased in some of the 5,311 grid cells of the Eastern Oregon study area and increased in others.The range of data values is from -18.2% to +194.1%. The mean value is -78.0% The vegetation model MC1 (e.g. Bachelet et al. 2001) was used to simulate vegetation dynamics, associated carbon and nitrogen cycle, water budget, and wild fire impacts at two study sites, one in eastern Oregon (Deschutes and Fremont-Winema National Forests)...

This map represents the difference in annual minimum temperatures, simulated by the model MC1 between the 30-year periods 1971-2000 and 2070-2099, using the Hadley future climate projection under the A2 anthropogenic emission scenario. The average annual minimum temperature for the respective 30-year periods increased in all of the 5,311 grid cells of the Apache-Sitgreaves study area. The greatest increase was 4.35 C; the least increase was 4.26 C; and the mean increase was 4.31 C. The vegetation model MC1 (e.g. Bachelet et al. 2001) was used to simulate vegetation dynamics, associated carbon and nitrogen cycle, water budget, and wild fire impacts at two study sites in eastern Oregon (Deschutes and Fremont-Winema...

NARCCAP: http://www.narccap.ucar.edu/ The North American Regional Climate Change Assessment Program (NARCCAP) is an international program that will serve the climate scenario needs of the United States, Canada, and northern Mexico. NARCCAP is systematically investigating the uncertainties in future climate projections on the regional level. NARCCAP closely matches the regional climate models (RCMs) with multiple atmosphere-ocean general circulation models (AOGCMs) along with the A2 scenario from the Special Report on Emission Scenarios (SRES) over an area covering most of North America. NARCCAP also validates the regional climate model performance by driving the RCMs with reanalyses, which is similar to driving...

This map represents the mean for the 30 year period 1971-2000 of the annual peak value of the fraction of live vegetation carbon which is in herbaceous (as opposed to woody) vegetation. The data is from output variable GFRAC in MC1 version B60. The data values are unitless fractions and range from 0 to 1. The vegetation model MC1 (e.g. Bachelet et al. 2001) was used to simulate vegetation dynamics, associated carbon and nitrogen cycle, water budget, and wild fire impacts at two study sites in eastern Oregon (Deschutes and Fremont-Winema National Forests) and in Arizona (Apache Sitgreaves National Forest area) in the context of a project funded by the USDA Forest Service (PNW 09-JV-11261900-003). Historical climate...

Agreement in predicted marten year-round distribution derived from future (2046-2065) climate projections and vegetation simulations using 3 GCMs (Hadley CM3 (Johns et al. 2003), MIROC (Hasumi and Emori 2004), and CSIRO Mk3 (Gordon 2002)) under the A2 emissions scenario (Naki?enovi? et al. 2000). Projected marten distribution was created with Maxent (Phillips et al. 2006) using marten detections (N = 302, spanning 1990 – 2011) and eight predictor variables: mean potential evapotranspiration, mean annual precipitation, mean fraction of vegetation carbon burned, mean forest carbon (g C m2), mean fraction of vegetation carbon in forest, understory index (fraction of grass vegetation carbon in forest), average maximum...

These maps are a digital representation of the individual tree species range maps of the Atlas of the United States Trees by Elbert L. Little, Jr. The atlas shows the natural distribution or range of the native tree species of North America. These coverages represent 3 volumes of the atlas. Little's tree extent maps can be found in the Data Basin gallery here: http://app.databasin.org/app/pages/galleryPage.jsp?id=5e449f3c91304f498a96299a9d5460a3

This data was produced by MC1 version B41, using historical climate from the PRISM group at OSU.

These maps are a digital representation of the individual tree species range maps of the Atlas of the United States Trees by Elbert L. Little, Jr. The atlas shows the natural distribution or range of the native tree species of North America. These coverages represent 3 volumes of the atlas. Little's tree extent maps can be found in the Data Basin gallery here: http://app.databasin.org/app/pages/galleryPage.jsp?id=5e449f3c91304f498a96299a9d5460a3

These maps are a digital representation of the individual tree species range maps of the Atlas of the United States Trees by Elbert L. Little, Jr. The atlas shows the natural distribution or range of the native tree species of North America. These coverages represent 3 volumes of the atlas.

These maps are a digital representation of the individual tree species range maps of the Atlas of the United States Trees by Elbert L. Little, Jr. The atlas shows the natural distribution or range of the native tree species of North America. These coverages represent 3 volumes of the atlas.

These maps are a digital representation of the individual tree species range maps of the Atlas of the United States Trees by Elbert L. Little, Jr. The atlas shows the natural distribution or range of the native tree species of North America. These coverages represent 3 volumes of the atlas.
For his MS thesis, Brendan Rogers used climate data from the PRISM group (Chris Daly, Oregon State University) at a 30arc second (800m) spatial grain across the western 2/3 of the states of Oregon and Washington to generate a climatology or baseline. He then created future climate change scenarios using statistical downscaling to create anomalies from three General Circulation Models (CSIRO Mk3, MIROC 3.2 medres, and Hadley CM 3), each run through three CO2 emission scenarios (SRES B1, A1B, and A2).

For his MS thesis, Brendan Rogers used climate data from the PRISM group (Chris Daly, Oregon State University) at a 30arc second (800m) spatial grain across the western 2/3 of the states of Oregon and Washington to generate a climatology or baseline. He then created future climate change scenarios using statistical downscaling to create anomalies from three General Circulation Models (CSIRO Mk3, MIROC 3.2 medres, and Hadley CM 3), each run through three CO2 emission scenarios (SRES B1, A1B, and A2).
|

|
