Filters: Tags: coast (X)
53 results (55ms)|
Filters
Contacts
(Less)
|
The spring 2017 mainland sea otter count began on April 30, and although the shore-based counts were completed by May 12, 2017, the aerial counts were not completed until July 12, 2017. Overall viewing conditions this year were good, although not as good as conditions experienced during the 2016 spring census (View Score 2.4 versus 3.1, where 0=poor, 1=fair, 2=good, 3=very good, and 4=excellent). The surface canopies of kelp (Macrocystis sp.) were considered by most participants to be considerably below normal for this time of year in most areas of the mainland range. Sea otters along the mainland coast were surveyed from Pillar Point in San Mateo County in the north to Rincon Point in the south at the Santa Barbara/Ventura...
This dataset represents an archived record of annual California sea otter surveys from 1985-2014. Survey procedures involve counting animals during the "spring survey" -- generally beginning in late April or early May and usually ending in late May early June but may extend into early July, depending on weather conditions. Annual surveys are organized by survey year and within each year, three shapefiles are included: census summary of southern sea otter, extra limit counts of southern sea otter, and range extent of southern sea otter. The surveys, conducted cooperatively by scientists of the U.S. Geological Survey, California Department of Fish and Wildlife, U.S. Fish and Wildlife Service and Monterey Bay Aquarium...
Categories: Data;
Tags: California,
Central California Coastal,
Coast,
Southern California Coastal,
USGS Science Data Catalog (SDC),

Locations of Lake Michigan Coastal Wetlands (40 acres or more).
Geophysical and geological survey data were collected off Town Neck Beach in Sandwich, Massachusetts, in May and July 2016. Approximately 130 linear kilometers of subbottom (seismic-reflection) and 234-kilohertz interferometric sonar (bathymetric and backscatter) data were collected along with sediment samples, sea floor photographs, and (or) video at 26 sites within the geophysical survey area. Sediment grab samples were collected at 19 of the 26 sampling sites and video and (or) photographic imagery of the sea floor were taken at all 26 sites. These survey data are used to characterize the sea floor by identifying sediment-texture, seabed morphology, and underlying geologic structure and stratigraphy. Data collected...

The dataset was developed for submission to the USGS National Hydrography Dataset (NHD). As the SEAK Hydro database evolves, so to will the metadata for this dataset. Until noted otherwise, please reference this metadata for an older version of the source data. This dataset contains polygons describing high and low tide shorelines with delineated intertidal areas for Southeast Alaska.
The Sea Surface Temperature (SST) data of the nearshore region of the North Pacific show temperature ranges in degrees C using points whose locations correspond to the centroids of AVHRR Pathfinder version 5 monthly, global, 4 km data set (PFSST V50). The pathfinder rasters are available from the Physical Oceanography Distributed Active Archive Center (PO.DAAC), hosted by NASA JPL. The data points in this dataset lie within a 20 km buffer from the GSHHS (Global Self-consistent, Hierarchical, High-resolution Shoreline) coastline. The GSHHS vector data are available from the National Geophysical Data Center (NGDC). Furthermore, each point in the SST dataset is categorized by the ecoregion in which it is located. This...
This dataset represents salt marsh communities in the Northeast Atlantic coast. The classification was produced using a combination of Digital Elevation Model (DEM) and National Agriculture Imagery Program (NAIP) multispectral imagery. This dataset combined with "Tidal Marsh Vegetation Classification, no DEM, 3m, Northeast U.S." provides a contiguous classification of tidal marsh cover types from coastal Maine to Virginia. The eight distinct cover/community types identified are: High marsh: Area flooded during spring tides related to the lunar cycle and dominated by Spartina patens, Distichlis spicata, Juncus gerardii, and short form Spartina alterniflora. Other species include Juncus roemerianus, Scirpus pungens,...
Categories: Data;
Types: ArcGIS REST Map Service,
ArcGIS Service Definition,
Downloadable,
Map Service;
Tags: coast,
hurricane sandy,
marsh,
salt,
sea level rise,
This dataset represents salt marsh communities in the Northeast Atlantic coast. The classification was produced using National Agriculture Imagery Program (NAIP) multispectral imagery for areas where no DEM was available to complete the full classification. This dataset combined with "Tidal Marsh Vegetation Classification, DEM, Northeast U.S." provides a contiguous classification of tidal marsh cover types from coastal Maine to Virginia. The six distinct cover/community types identified are: 1. High marsh: Area flooded during spring tides related to the lunar cycle and dominated by Spartina patens, Distichlis spicata, Juncus gerardii, and short form Spartina alterniflora. Other species include Juncus roemerianus,...
Categories: Data;
Types: ArcGIS REST Map Service,
ArcGIS Service Definition,
Downloadable,
Map Service;
Tags: coast,
hurricane sandy,
marsh,
salt,
sea level rise,
Coastal British Columbia bathymetry
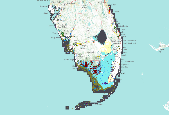
This is a land cover dataset developed by Florida Natural Areas Inventory for coastal conservation planning purposes. It is derived from two primary sources: 1) The Florida Cooperative Land Cover Map(CLC), v.2, a hybrid land cover that combines best available statewide and local land cover data sources; and 2) a revision of the CLC based on review of 2009 – 2011 high resolution aerial photography for a subset of remaining natural uplands that correspond to areas identified in the Assessment of Florida’s Remaining Coastal Upland Natural Communities (Johnson and Gulledge 2005). All data were clipped to a coastal analysis zone defined as 3 m elevation plus 1 kmbuffer. The classification scheme is a modified version...
The dominant characteristics of wave energy variability in the eastern North Pacific are described from NOAA National Data Buoy Center (NDBC) buoy data collected from 1981 to 2003. Ten buoys at distributed locations were selected for comparison based on record duration and data continuity. Long-period (LP) [T > 12] s, intermediate-period [6 ≤ T ≤ 12] s, and short-period [T < 6] s wave spectral energy components are considered separately. Empirical orthogonal function (EOF) analyses of monthly wave energy anomalies reveal that all three wave energy components exhibit similar patterns of spatial variability. The dominant mode represents coherent heightened (or diminished) wave energy along the West Coast from Alaska...
Categories: Publication;
Types: Citation;
Tags: atmosphere-ocean forcing,
climate variability,
coast
The GIS shapefile "Census summary of southern sea otter 2016" provides a standardized tool for examining spatial patterns in abundance and demographic trends of the southern sea otter (Enhydra lutris nereis), based on data collected during the spring 2016 range-wide census. The USGS range-wide sea otter census has been undertaken twice a year since 1982, once in May and once in October, using consistent methodology involving both ground-based and aerial-based counts. The spring census is considered more accurate than the fall count, and provides the primary basis for gauging population trends by State and Federal management agencies. This Shape file includes a series of summary statistics derived from the raw census...
Categories: Data;
Types: Citation,
Downloadable,
Map Service,
OGC WFS Layer,
OGC WMS Layer,
Shapefile;
Tags: California,
Central California Coast,
Coast,
Southern California Coast,
aerial counts,
The GIS shapefile Census_sum_2019 provides a standardized tool for examining spatial patterns in abundance and demographic trends of the southern sea otter (Enhydra lutris nereis), based on data collected during the spring 2019 range-wide census. The USGS spring range-wide sea otter census has been undertaken each year since 1982, using consistent methodology involving both ground-based and aerial-based counts. The spring census provides the primary basis for gauging population trends by State and Federal management agencies. This shapefile includes a series of summary statistics derived from the raw census data, including sea otter density (otters per square kilometer of habitat), linear density (otters per kilometer...
Categories: Data;
Types: Downloadable,
Map Service,
OGC WFS Layer,
OGC WMS Layer,
Shapefile;
Tags: California,
Central California Coastal,
Coast,
Southern California Coastal,
aerial counts,
The GIS shapefile "Census summary of southern sea otter 2018" provides a standardized tool for examining spatial patterns in abundance and demographic trends of the southern sea otter (Enhydra lutris nereis), based on data collected during the spring 2018 range-wide census. The USGS spring range-wide sea otter census has been undertaken each year since 1982, using consistent methodology involving both ground-based and aerial-based counts. The spring census provides the primary basis for gauging population trends by State and Federal management agencies. This Shape file includes a series of summary statistics derived from the raw census data, including sea otter density (otters per square km of habitat), linear density...
Categories: Data;
Types: Downloadable,
Map Service,
OGC WFS Layer,
OGC WMS Layer,
Shapefile;
Tags: California,
Central California Coastal,
Coast,
Southern California Coastal,
aerial counts,
We summarize available information on Pacific walrus haulouts from available reports, interviews with coastal residents and aviators, and personal observations of the authors. We provide this in the form of a georeferenced database that may be queried and displayed with standard geographic information system and database management software. The database contains 150 records of Pacific walrus haulouts, with a summary of basic characteristics on maximum haulout size, age-sex composition, season of use, and decade of most recent use. Citations to reports are provided as a bibliographic database.
Categories: Data;
Types: ArcGIS REST Map Service,
ArcGIS Service Definition,
Citation,
Downloadable,
Map Service,
OGC WFS Layer,
OGC WMS Layer,
Shapefile;
Tags: Alaska,
Arctic,
Arctic Ocean,
Beaufort Sea,
Bering Sea,
This part of the data release presents orthoimagery spanning the ocean shoreline of Alaska from Icy Cape to Cape Prince of Wales. Aerial images were collected, and data were processed, by Fairbanks Fodar (https://www.fairbanksfodar.com) in Fairbanks, Alaska, for the U.S. Geological Survey. The aerial images, from which the orthoimages were created, were collected in 2016 between August 29 and September 4 and extend from the shoreline to 400-4000 meters inland. The aerial images were collected with precise Global Positioning System (GPS) navigation data from a manned aircraft and were then processed into orthoimages photogrammetrically and using structure-from-motion (SFM) processing methods as described in Nolan...
The spring 2016 mainland sea otter count began on 1 May and was completed on 11 May. Overall viewing conditions this year were very good, being more favorable than those during the 2015 spring census (3.1 vs. 2.6, where 0=poor, 1=fair, 2=good, 3=very good, and 4=excellent) and contributed to the relatively short duration of the count. The surface canopies of kelp (Macrocystis sp.) were considered by most participants to be below normal for this time of year in the northern half of the range and about normal in the southern half. Sea otters along the mainland were surveyed (using a combination of ground-based and aerial-based surveys) from Pillar Point in San Mateo County in the north, to Rincon Point in the south...
Geophysical and geological survey data were collected off Town Neck Beach in Sandwich, Massachusetts, in May and July 2016. Approximately 130 linear kilometers of subbottom (seismic-reflection) and 234-kilohertz interferometric sonar (bathymetric and backscatter) data were collected along with sediment samples, sea floor photographs, and (or) video at 26 sites within the geophysical survey area. Sediment grab samples were collected at 19 of the 26 sampling sites and video and (or) photographic imagery of the sea floor were taken at all 26 sites. These survey data are used to characterize the sea floor by identifying sediment-texture, seabed morphology, and underlying geologic structure and stratigraphy. Data collected...
Persistent spring and summer northerly surface winds are the defining climatological feature of the western coast of North America, especially south of the Oregon coast. Northerly surface winds are important for upwelling and a vast array of other biological, oceanic, and atmospheric processes. Intermittence in northerly coastal surface wind is characterized and wind events are quantitatively defined using coastal buoy data south of Cape Mendocino on the northern California coast. The defined wind events are then used as a basis for composites in order to explain the spatial evolution of various atmospheric and oceanic processes. Wind events involve large-scale changes in the three-dimensional atmospheric circulation...

This is a land cover dataset developed by Florida Natural Areas Inventory for coastal conservation planning purposes. It is derived from two primary sources: 1) The Florida Cooperative Land Cover Map(CLC), v.2, a hybrid land cover that combines best available statewide and local land cover data sources; and 2) a revision of the CLC based on review of 2009 – 2011 high resolution aerial photography for a subset of remaining natural uplands that correspond to areas identified in the Assessment of Florida’s Remaining Coastal Upland Natural Communities (Johnson and Gulledge 2005). All data were clipped to a coastal analysis zone defined as 3 m elevation plus 1 kmbuffer. The classification scheme is a modified version...
|

|
