Filters: Tags: contours (X) > Types: OGC WFS Layer (X) > Types: Map Service (X)
34 results (64ms)|
Filters
Date Range
Extensions Types
Contacts
Categories Tag Types Tag Schemes |
Statistical analyses and maps representing mean, high, and low water-level conditions in the surface water and groundwater of Miami-Dade County were made by the U.S. Geological Survey, in cooperation with the Miami-Dade County Department of Regulatory and Economic Resources, to help inform decisions necessary for urban planning and development. Sixteen maps were created that show contours of (1) the mean of daily water levels at each site during October and May for the 2000-2009 water years; (2) the 25th, 50th, and 75th percentiles of the daily water levels at each site during October and May and for all months during 2000-2009; and (3) the differences between mean October and May water levels, as well as the differences...
Categories: Data;
Types: Downloadable,
Map Service,
OGC WFS Layer,
OGC WMS Layer,
Shapefile;
Tags: Biscayne Bay,
Biscayne aquifer,
Florida,
Florida Bay,
Miami-Dade County,
Dataset contains contours at 10-foot intervals of the San Antonio Reservoir, California, based on the bathymetric survey conducted in April of 2018. Files are provided as geospatial shapefiles and CAD (.dwg file extension) files.
Types: Map Service,
OGC WFS Layer,
OGC WMS Layer,
OGC WMS Service;
Tags: James H Turner Dam,
San Antonio Reservoir,
capacity,
contours,
reservoir
This dataset depicts 10 foot contours derived from the USGS 1/3 arc second (10m) digital elevation model.
Categories: Data;
Types: ArcGIS REST Map Service,
ArcGIS Service Definition,
Citation,
Downloadable,
Map Service,
OGC WFS Layer,
OGC WMS Layer,
Shapefile;
Tags: Klamath Marsh NWR,
Oregon (OR),
USFWS,
contours,
elevation,
Statistical analyses and maps representing mean, high, and low water-level conditions in the surface water and groundwater of Miami-Dade County were made by the U.S. Geological Survey, in cooperation with the Miami-Dade County Department of Regulatory and Economic Resources, to help inform decisions necessary for urban planning and development. Sixteen maps were created that show contours of (1) the mean of daily water levels at each site during October and May for the 2000-2009 water years; (2) the 25th, 50th, and 75th percentiles of the daily water levels at each site during October and May and for all months during 2000-2009; and (3) the differences between mean October and May water levels, as well as the differences...
Categories: Data;
Types: Downloadable,
Map Service,
OGC WFS Layer,
OGC WMS Layer,
Shapefile;
Tags: Biscayne Bay,
Biscayne aquifer,
Florida,
Florida Bay,
Miami-Dade County,
Contours generated from 10m National Elevation Dataset and clipped to the boundary of Modoc National Wildlife Refuge.
Categories: Data;
Types: ArcGIS REST Map Service,
ArcGIS Service Definition,
Citation,
Downloadable,
Map Service,
OGC WFS Layer,
OGC WMS Layer,
Shapefile;
Tags: California (CA),
Modoc NWR,
USFWS,
contours,
terrain
Statistical analyses and maps representing mean, high, and low water-level conditions in the surface water and groundwater of Miami-Dade County were made by the U.S. Geological Survey, in cooperation with the Miami-Dade County Department of Regulatory and Economic Resources, to help inform decisions necessary for urban planning and development. Sixteen maps were created that show contours of (1) the mean of daily water levels at each site during October and May for the 2000-2009 water years; (2) the 25th, 50th, and 75th percentiles of the daily water levels at each site during October and May and for all months during 2000-2009; and (3) the differences between mean October and May water levels, as well as the differences...
Categories: Data;
Types: Downloadable,
Map Service,
OGC WFS Layer,
OGC WMS Layer,
Shapefile;
Tags: Biscayne Bay,
Biscayne aquifer,
Florida,
Florida Bay,
Miami-Dade County,
This map shows the structural configuration on the top of the Cotton Valley Group in feet below sea level. The map was produced by calculating the difference between a datum at the land surface (either the kelly bushing elevation or the ground surface elevation) and the reported depth of the Cotton Valley Group. This resulted in 10,687 wells for which locations were available. After deleting the wells with obvious data problems, a total of 10,504 wells were used to generate the map. The data are provided as both lines and polygons, and the proprietary wells that penetrate the top of the Cotton Valley Group are graphically displayed as quarter-mile cells. The well information was initially retrieved from the IHS...
The structure contours were created using biostratigraphic data in the Paleo-Data, Inc., Tenroc Regional Geologic Database. The depths of the microfossil locations were associated with the wells data provided by the Louisiana Department of Natural Resources. Because of the proprietary nature of the Tenroc database, no actual data can be shown and only those data points contained in the Louisiana State wells database are included in the control points layer. Contouring was accomplished in Dynamic Graphics, Inc., EarthVision modeling software (v.5) using minimum tension gridding. Three custom programs were used to convert contour lines generated from grids in EarthVision to Arc/Info coverages and then to shapefiles....
Categories: Data,
pre-SM502.8;
Types: Downloadable,
Map Service,
OGC WFS Layer,
OGC WMS Layer,
Shapefile;
Tags: Coal,
Coalbed Methane,
Coalbed methane resources,
Contours,
Earth Science,
Statistical analyses and maps representing mean, high, and low water-level conditions in the surface water and groundwater of Miami-Dade County were made by the U.S. Geological Survey, in cooperation with the Miami-Dade County Department of Regulatory and Economic Resources, to help inform decisions necessary for urban planning and development. Sixteen maps were created that show contours of (1) the mean of daily water levels at each site during October and May for the 2000-2009 water years; (2) the 25th, 50th, and 75th percentiles of the daily water levels at each site during October and May and for all months during 2000-2009; and (3) the differences between mean October and May water levels, as well as the differences...
Categories: Data;
Types: Downloadable,
Map Service,
OGC WFS Layer,
OGC WMS Layer,
Shapefile;
Tags: Biscayne Bay,
Biscayne aquifer,
Florida,
Florida Bay,
Miami-Dade County,
The structure contours were created using biostratigraphic data in the Paleo-Data, Inc., Tenroc Regional Geologic Database. The depths of the microfossil locations were associated with the wells data provided by the Louisiana Department of Natural Resources. Because of the proprietary nature of the Tenroc database, no actual data can be shown and only those data points contained in the Louisiana State wells database are included in the control points layer. Contouring was accomplished in Dynamic Graphics, Inc., EarthVision modeling software (v.5) using minimum tension gridding. Three custom programs were used to convert contour lines generated from grids in EarthVision to Arc/Info coverages and then to shapefiles....
Categories: Data,
pre-SM502.8;
Types: Downloadable,
Map Service,
OGC WFS Layer,
OGC WMS Layer,
Shapefile;
Tags: Coal,
Coalbed Methane,
Coalbed methane resources,
Contours,
Earth Science,
Statistical analyses and maps representing mean, high, and low water-level conditions in the surface water and groundwater of Miami-Dade County were made by the U.S. Geological Survey, in cooperation with the Miami-Dade County Department of Regulatory and Economic Resources, to help inform decisions necessary for urban planning and development. Sixteen maps were created that show contours of (1) the mean of daily water levels at each site during October and May for the 2000-2009 water years; (2) the 25th, 50th, and 75th percentiles of the daily water levels at each site during October and May and for all months during 2000-2009; and (3) the differences between mean October and May water levels, as well as the differences...
Categories: Data;
Types: Downloadable,
Map Service,
OGC WFS Layer,
OGC WMS Layer,
Shapefile;
Tags: Biscayne Bay,
Biscayne aquifer,
Florida,
Florida Bay,
Miami-Dade County,
The thickness contours were created using biostratigraphic data in the Paleo-Data, Inc., Tenroc Regional Geologic Database. The depths of the microfossil locations were associated with the wells data provided by the Louisiana Department of Natural Resources. Because of the proprietary nature of the Tenroc database, no actual data can be shown and only those data points contained in the Louisiana State wells database are included in the control points layer. Contouring was accomplished in Dynamic Graphics, Inc., EarthVision modeling software (v.5) using minimum tension gridding. Three custom programs were used to convert contour lines generated from grids in EarthVision to Arc/Info coverages and then to shapefiles....
Categories: Data,
pre-SM502.8;
Types: Downloadable,
Map Service,
OGC WFS Layer,
OGC WMS Layer,
Shapefile;
Tags: Coal,
Coalbed Methane,
Coalbed methane resources,
Contours,
Earth Science,
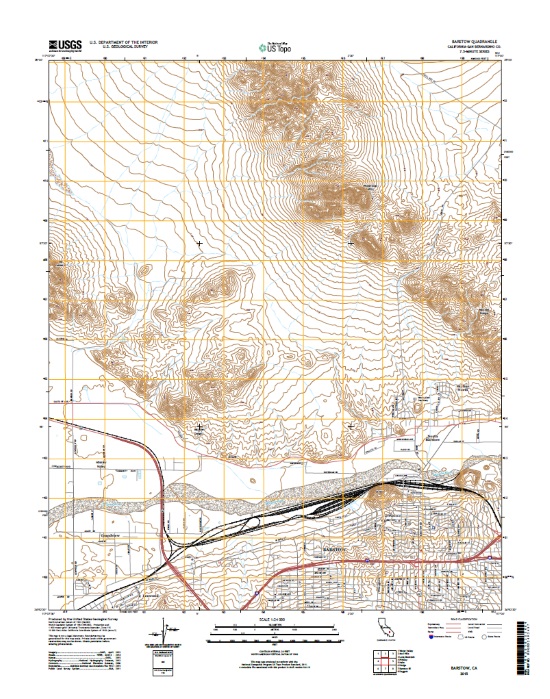
Layers of geospatial data include contours, boundaries, land cover, hydrography, roads, transportation, geographic names, structures, and other selected map features.
Statistical analyses and maps representing mean, high, and low water-level conditions in the surface water and groundwater of Miami-Dade County were made by the U.S. Geological Survey, in cooperation with the Miami-Dade County Department of Regulatory and Economic Resources, to help inform decisions necessary for urban planning and development. Sixteen maps were created that show contours of (1) the mean of daily water levels at each site during October and May for the 2000-2009 water years; (2) the 25th, 50th, and 75th percentiles of the daily water levels at each site during October and May and for all months during 2000-2009; and (3) the differences between mean October and May water levels, as well as the differences...
Categories: Data;
Types: Downloadable,
Map Service,
OGC WFS Layer,
OGC WMS Layer,
Shapefile;
Tags: Biscayne Bay,
Biscayne aquifer,
Florida,
Florida Bay,
Miami-Dade County,
|

|
