Filters: Tags: contours (X) > partyWithName: California Water Science Center (X)
1 result (9ms)|
Filters
Date Range
Contacts Categories Tag Types Tag Schemes |
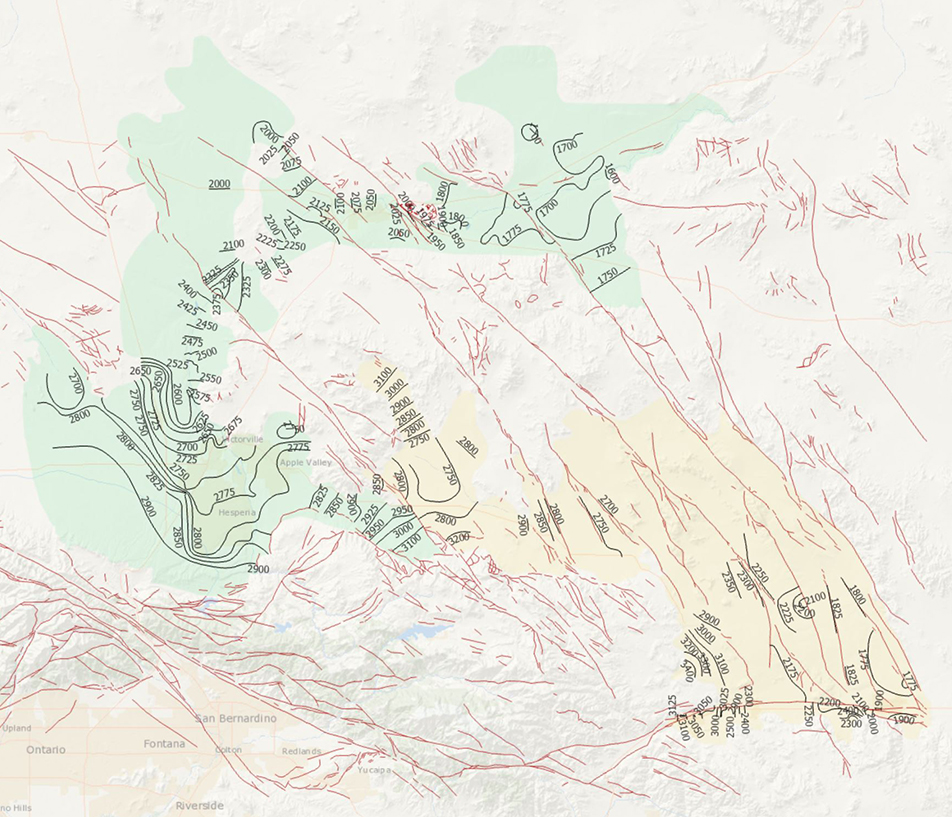
During 2014, the U.S. Geological Survey and other agencies made approximately 1,026 water-level measurements in the Mojave River and Morongo groundwater basins. These data document recent conditions and, when compared with previous data, changes in groundwater levels. A water-level contour map was drawn using data from about 610 wells, providing coverage for most of the basins. Twenty-four hydrographs show long-term (1930-2014) water-level conditions throughout the basins, and 9 short-term (1992 to 2014) hydrographs show the effects of recharge and discharge along the Mojave River. In addition, a water-level-change map was compiled to compare was compiled to compare the 2014 water levels to the 2012 water levels...
Categories: Data Release - Revised;
Tags: USGS,
USGS Science Data Catalog (SDC),
contours,
drainage basin,
ground water,
|

|
