Filters: Tags: distribution (X)
932 results (19ms)|
Filters
Date Range
Extensions Types Contacts
Categories
Tag Types
|
We attempted to discern the contributions of physical habitat,water chemistry, nutrients, and contaminants from historic lead-zinc miningactivities on the riffle-dwelling benthic fish community of the SpringRiver, a midwestern warmwater stream that originates in Missouri and flowsinto Kansas and Oklahoma. The Spring River has a fish community thatincludes the Neosho madtom, Noturus placidus, a species Federally listed asthreatened. Although anthropogenic factors, such as contaminants, limitedpopulations and densities of fishes, an integrated approach that assessednatural and anthropogenic factors was necessary to effectively estimate theinfluence of the latter. Fish populations in the Spring River, especiallyNeosho...
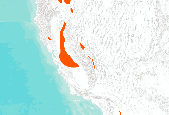
The GIS shapefile Extra limit counts of southern sea otters 2019 is a point layer representing the locations of sea otter sightings that fall outside the officially recognized range of the southern sea otter (Enhydra lutris nereis) in mainland California. These data were collected during the spring 2019 range-wide census. The USGS range-wide sea otter census has been undertaken each year since 1982, using consistent methodology involving both ground-based and aerial-based counts. The spring census provides the primary basis for gauging population trends by State and Federal management agencies. Sea otter distribution in California (the mainland range) is considered to comprise a band of potential habitat stretching...
Categories: Data;
Types: Downloadable,
Map Service,
OGC WFS Layer,
OGC WMS Layer,
Shapefile;
Tags: California,
Central California Coastal,
Southern California Coastal,
aerial counts,
biogeography,

The source of this coverage data set is the fish biodiversity maps created for The Nature Conservancy (TNC) as part of their Hexagon Project. Professor Peter Moyle and his graduate student, Paul Randall, of the Department of Wildlife and Fisheries Conservation Biology at the University of California, Davis were hired to produce range maps for all known fish species that presently occur in California. Each coverage denotes a separate fish species (refer to the species coverage key below). The polygons are estimated to be accurate at a scale of roughly 1:1,000,000. Other California fish species distributions can be found in a gallery at: http://app.databasin.org/app/pages/galleryPage.jsp?id=099b47b7394f47b6b42764829e8a8f09

The source of this coverage data set is the fish biodiversity maps created for The Nature Conservancy (TNC) as part of their Hexagon Project. Professor Peter Moyle and his graduate student, Paul Randall, of the Department of Wildlife and Fisheries Conservation Biology at the University of California, Davis were hired to produce range maps for all known fish species that presently occur in California. Each coverage denotes a separate fish species (refer to the species coverage key below). The polygons are estimated to be accurate at a scale of roughly 1:1,000,000. Other California fish species distributions can be found in a gallery at: http://app.databasin.org/app/pages/galleryPage.jsp?id=099b47b7394f47b6b42764829e8a8f09

The source of this coverage data set is the fish biodiversity maps created for The Nature Conservancy (TNC) as part of their Hexagon Project. Professor Peter Moyle and his graduate student, Paul Randall, of the Department of Wildlife and Fisheries Conservation Biology at the University of California, Davis were hired to produce range maps for all known fish species that presently occur in California. Each coverage denotes a separate fish species (refer to the species coverage key below). The polygons are estimated to be accurate at a scale of roughly 1:1,000,000. Other California fish species distributions can be found in a gallery at: http://app.databasin.org/app/pages/galleryPage.jsp?id=099b47b7394f47b6b42764829e8a8f09

MooseWinterRange is an ESRI SDE Feature Class showing that part of the overall range where 90% of the individuals are located during the winter months. This winter time frame will be delineated with specific start/end dates for each moose population within the state (i.e.: November 15 to April 1). This information was derived from field personnel. A variety of data capture techniques were used including drawing on mylar overlays at 1:50,000 scale USGS county mapsheets and implementation of the SmartBoard Interactive Whiteboard using stand-up, real-time digitizing at various scales (Cowardin, M., M. Flenner. March 2003. Maximizing Mapping Resources. GeoWorld 16(3):32-35). Dataset was acquired from a third party...

The source of this coverage data set is the fish biodiversity maps created for The Nature Conservancy (TNC) as part of their Hexagon Project. Professor Peter Moyle and his graduate student, Paul Randall, of the Department of Wildlife and Fisheries Conservation Biology at the University of California, Davis were hired to produce range maps for all known fish species that presently occur in California. Each coverage denotes a separate fish species (refer to the species coverage key below). The polygons are estimated to be accurate at a scale of roughly 1:1,000,000. Other California fish species distributions can be found in a gallery at: http://app.databasin.org/app/pages/galleryPage.jsp?id=099b47b7394f47b6b42764829e8a8f09
The source of this coverage data set is the fish biodiversity maps created for The Nature Conservancy (TNC) as part of their Hexagon Project. Professor Peter Moyle and his graduate student, Paul Randall, of the Department of Wildlife and Fisheries Conservation Biology at the University of California, Davis were hired to produce range maps for all known fish species that presently occur in California. Each coverage denotes a separate fish species (refer to the species coverage key below). The polygons are estimated to be accurate at a scale of roughly 1:1,000,000. Other California fish species distributions can be found in a gallery at: http://app.databasin.org/app/pages/galleryPage.jsp?id=099b47b7394f47b6b42764829e8a8f09

OspreyNestsites is an ESRI SDE Feature Class showing a 0.5 mile buffer zone around active, inactive, and unknown Osprey (Pandion haliaetus) nests in Colorado. Refer to the metadata for the Status attribute field for activity definitions (the metadata Stylesheet must be changed to FGDC to view). This information was derived from field personnel. A variety of data capture techniques were used including drawing on mylar overlays at 1:50,000 scale USGS county mapsheets and implementation of the SmartBoard Interactive Whiteboard using stand-up, real-time digitizing at various scales (Cowardin, M., M. Flenner. March 2003. Maximizing Mapping Resources. GeoWorld 16(3):32-35). Dataset was acquired from a third party distributor...

The source of this coverage data set is the fish biodiversity maps created for The Nature Conservancy (TNC) as part of their Hexagon Project. Professor Peter Moyle and his graduate student, Paul Randall, of the Department of Wildlife and Fisheries Conservation Biology at the University of California, Davis were hired to produce range maps for all known fish species that presently occur in California. Each coverage denotes a separate fish species (refer to the species coverage key below). The polygons are estimated to be accurate at a scale of roughly 1:1,000,000. Other California fish species distributions can be found in a gallery at: http://app.databasin.org/app/pages/galleryPage.jsp?id=099b47b7394f47b6b42764829e8a8f09

The source of this coverage data set is the fish biodiversity maps created for The Nature Conservancy (TNC) as part of their Hexagon Project. Professor Peter Moyle and his graduate student, Paul Randall, of the Department of Wildlife and Fisheries Conservation Biology at the University of California, Davis were hired to produce range maps for all known fish species that presently occur in California. Each coverage denotes a separate fish species (refer to the species coverage key below). The polygons are estimated to be accurate at a scale of roughly 1:1,000,000. Other California fish species distributions can be found in a gallery at: http://app.databasin.org/app/pages/galleryPage.jsp?id=099b47b7394f47b6b42764829e8a8f09

The source of this coverage data set is the fish biodiversity maps created for The Nature Conservancy (TNC) as part of their Hexagon Project. Professor Peter Moyle and his graduate student, Paul Randall, of the Department of Wildlife and Fisheries Conservation Biology at the University of California, Davis were hired to produce range maps for all known fish species that presently occur in California. Each coverage denotes a separate fish species (refer to the species coverage key below). The polygons are estimated to be accurate at a scale of roughly 1:1,000,000. Other California fish species distributions can be found in a gallery at: http://app.databasin.org/app/pages/galleryPage.jsp?id=099b47b7394f47b6b42764829e8a8f09

Bighorn sheep distribution and winter ranges were reviewed and updated during 2002. The layer does not necessarily include overall distribution or winter range within Tribal lands/Indian Reservations or National Park Service lands. Overall distribution polygons represent general or year round habitat. Winter range polygons represent areas occupied by the species from November 15 to March 1. The polygon attribute to select overall distribution and/or winter range areas for big horn sheep is BHS_USE.
Distributional patterns and species diversity of benthic insects in an alpine stream in Gunnison County, Colorado, USA were investigated on several levels of spatial scale, from faunal replacement over 1,000 vertical m to microdistribution within the stony substratum. Ecotones including zonation in terrestrial vegetation and in trout distribution did not appear to affect faunal replacement. Competition among congeners accounted for 7-30% of the cases, while in the majority of species, faunal replacement appeared to be associated with gradual changes in the physical gradient. Trout zonation may affect total numbers of insects, however, as the trout-free headwaters had two to six times higher insect densities. Microdistribution...
Categories: Publication;
Types: Citation,
Journal Citation;
Tags: Colorado,
Duke University Press,
Ecology,
aquatic,
benthic,
Habitat selection studies can make important contributions to habitat prioritization efforts for species of conservation concern. We present a large-scale collaborative effort to develop habitat selection models for Greater Sage-grouse (Centrocercus urophasianus) across large landscapes (Wyoming, USA) and multiple seasons. Greater Sage-grouse are limited to western semi-arid landscapes in North America, range-wide population declines have been documented, and the species is currently listed a “warranted but precluded” from listing under the U.S. Endangered Species Act. Wyoming is predicted to remain a stronghold for Sage-grouse populations and contains approximately 37% of the remaining birds. We developed Resource...
Categories: Data;
Types: Downloadable,
GeoTIFF,
Map Service,
Raster;
Tags: Centrocercus urophasianus,
Greater sage-grouse,
United States,
WY,
Wyoming,

This dataset represents presence of Black Spruce (Picea mariana) at year 100 (2095) from a single model run of LANDIS-II. The simulation assumed Intergovernmental Panel on Climate Change (IPCC) B2 emissions (moderate) and used the Hadley 3 global circulation model. Contemporary harvest rates and intensities were simulated.
Habitat selection studies can make important contributions to habitat prioritization efforts for species of conservation concern. We present a large-scale collaborative effort to develop habitat selection models for Greater Sage-grouse (Centrocercus urophasianus) across large landscapes (Wyoming, USA) and multiple seasons. Greater Sage-grouse are limited to western semi-arid landscapes in North America, range-wide population declines have been documented, and the species is currently listed a “warranted but precluded” from listing under the U.S. Endangered Species Act. Wyoming is predicted to remain a stronghold for Sage-grouse populations and contains approximately 37% of the remaining birds. We developed Resource...
Categories: Data;
Types: Downloadable,
GeoTIFF,
Map Service,
Raster;
Tags: Centrocercus urophasianus,
Greater sage-grouse,
United States,
WY,
Wyoming,
|

|
