Filters: Tags: domestic (X)
33 results (40ms)|
Filters
Date Range
Extensions Types Contacts
Categories Tag Types Tag Schemes
|
Long-term greenhouse gas emission reduction strategies for the Netherlands were studied, using a MARKAL energy model. The EMS study identifies longterm technological options for greenhouse gas emission reduction and assesses their cost-effectiveness, taking interactions between technologies into account. The project consisted of three parts: carbon dioxyde (CO 2) emission reduction in the energy system, integrated reduction of greenhouse gases from the energy system with consideration of upstream emissions and CO 2 reduction in the integrated energy and materials system. 500 energy technologies were assessed for their reduction potential. Significant emission reduction seems possible, but it takes an array of measures...
Categories: Publication;
Types: Citation;
Tags: Domestic,
Policy,
development,
energy,
energy policies
Evidence from cross-sectional growth regressions suggests that economies dependent on natural resource exports have had slower growth than resource scarce economies. Explanations for this "curse of resources" focus on institutional and market failures caused by resource abundance. With a simple two sector model exhaustible resource model, we demonstrate that the correlation between growth and natural resource abundance can be negative in the absence of market and institutional failures. Since there is no way to distinguish between efficient and inefficient equilibria on the basis of the negative correlation between growth and resource abundance, finding that correlation is not sufficient to conclude resources are...
Categories: Publication;
Types: Citation;
Tags: Hotelling's rule,
domestic,
oil,
production,
relevance
In 2015, the total amount of water withdrawn for recreational-landscape irrigation uses in Florida was estimated at 398 million gallons per day (Mgal/d). Withdrawals include water used for golf course and public and commercial landscape irrigation (parks, ball fields, highway medians, cemeteries, and other large-scale grass or landscaping areas) that have a consumptive water use permit from the local water management district specifically for golf course or landscape uses. This category does not include individual household lawn irrigation withdrawals. Fresh surface water accounted for 216 Mgal/d of the fresh water withdrawn while 182 Mgal/d was withdrawn from fresh groundwater sources. Palm Beach County accounted...

The SARP Flow Alteration Assessment provides a regional characterization of the distribution and risk of flow regime impairment of streams and rivers by anthropogenic sources at the NHD+ segment scale. This map illustrates the cumulative risk of flow alteration (RFA) from surface water use industrial water use in Texas and Oklahoma.  Water use is based on state permits for surface water withdrawals and returns.  The risk is based on the volume of water used monthly in the drainage area relative to the monthly volume of flow.  Risk of Flow Alteration categories:  ZERO     - 0% mean monthly flow depletion,  LOW      - > 0-10%,  MEDIUM - > 10-20%,  HIGH      - >20-100%, and Â...
This data set contains imagery from the National Agriculture Imagery Program (NAIP). The NAIP program is administered by USDA FSA and has been established to support two main FSA strategic goals centered on agricultural production. These are increase stewardship of America's natural resources while enhancing the environment, and to ensure commodities are procured and distributed effectively and efficiently to increase food security. The NAIP program supports these goals by acquiring and providing ortho imagery that has been collected during the agricultural growing season in the U.S. The NAIP ortho imagery is tailored to meet FSA requirements and is a fundamental tool used to support FSA farm and conservation programs....

The SARP Flow Alteration Assessment provides a regional characterization of the distribution and risk of flow regime impairment of streams and rivers by anthropogenic sources at the NHD+ segment scale. This map illustrates the local risk of flow alteration (RFA) from surface water use by water use sector for Texas and Oklahoma.  Water use is based on state permits for surface water withdrawals and returns.  The risk is based on the volume of water used monthly in the drainage area relative to the monthly volume of flow.  Risk of Flow Alteration categories:  ZERO     - 0% mean monthly flow depletion,  LOW      - > 0-10%,  MEDIUM - > 10-20%,  HIGH      - >20-100%, and  PROVISIONAL...
This data set contains imagery from the National Agriculture Imagery Program (NAIP). The NAIP program is administered by USDA FSA and has been established to support two main FSA strategic goals centered on agricultural production. These are increase stewardship of America's natural resources while enhancing the environment, and to ensure commodities are procured and distributed effectively and efficiently to increase food security. The NAIP program supports these goals by acquiring and providing ortho imagery that has been collected during the agricultural growing season in the U.S. The NAIP ortho imagery is tailored to meet FSA requirements and is a fundamental tool used to support FSA farm and conservation programs....
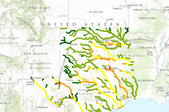
The SARP Flow Alteration Assessment provides a regional characterization of the distribution and risk of flow regime impairment of streams and rivers by anthropogenic sources at the NHD+ segment scale. This map illustrates the cumulative risk of flow alteration (RFA) from surface water use by water use sector for Texas and Oklahoma.  Water use is based on state permits for surface water withdrawals and returns.  The risk is based on the volume of water used monthly in the drainage area relative to the monthly volume of flow.Risk of Flow Alteration categories: ZERO     - 0% mean monthly flow depletion,  LOW      - > 0-10%,  MEDIUM - > 10-20%,  HIGH      - >20-100%, and PROVISIONAL...

The SARP Flow Alteration Assessment provides a regional characterization of the distribution and risk of flow regime impairment of streams and rivers by anthropogenic sources at the NHD+ segment scale. This map illustrates the cumulative risk of flow alteration (RFA) from surface water use for municipalities in Texas and Oklahoma.  Water use is based on state permits for surface water withdrawals and returns.  The risk is based on the volume of water used monthly in the drainage area relative to the monthly volume of flow.  Risk of Flow Alteration categories:  ZERO     - 0% mean monthly flow depletion,  LOW      - > 0-10%,  MEDIUM - > 10-20%,  HIGH      - >20-100%, and  PROVISIONAL...
Because of the inevitable depletion of fossil fuels and the corresponding release of carbon to the environment, the global energy future is complex. Some of the consequences may be politically and economically disruptive, and expensive to remedy. For the next several centuries, fuel requirements will increase with population, land use, and ecosystem degradation. Current or projected levels of aggregated energy resource use will not sustain civilization as we know it beyond a few more generations. At the same time, issues of energy security, reliability, sustainability, recoverability, and safety need attention. We supply a top-down, qualitative model—the surety model—to balance expenditures of limited resources...
Categories: Publication;
Types: Citation;
Tags: Transportation,
domestic,
emissions,
greenhouse gas,
trading
In 2015, the total amount of water withdrawn in Florida was estimated at 15,319 million gallons per day (Mgal/d). This includes 9,598 Mgal/d of saline water and 5,721 Mgal/d of fresh water. Water for public supply accounted for the majority of fresh water withdrawn (2,215 Mgal/d) followed closely by agricultural self-supplied (2,089 Mgal/d) for 2015. The remaining fresh water was withdrawn for power generation (434 Mgal/d), commercial-industrial-mining self-supplied (409 Mgal/d), recreational-landscape irrigation (397 Mgal/d), and domestic self-supplied (177 Mgal/d). Water withdrawn for power generation accounted for the majority of saline water withdrawn (9,425 Mgal/d) for 2015, followed by public supply (170...
This data set contains imagery from the National Agriculture Imagery Program (NAIP). The NAIP program is administered by USDA FSA and has been established to support two main FSA strategic goals centered on agricultural production. These are increase stewardship of America's natural resources while enhancing the environment, and to ensure commodities are procured and distributed effectively and efficiently to increase food security. The NAIP program supports these goals by acquiring and providing ortho imagery that has been collected during the agricultural growing season in the U.S. The NAIP ortho imagery is tailored to meet FSA requirements and is a fundamental tool used to support FSA farm and conservation programs....
The main properties of a phytoclimatic model are explained. It is a technique for theoretic simulation but a field work verification is essential. The methodology involves the transformation of a territory's general phytoclimate data into particular phytoclimate estimates. We are dealing with a simple mathematical climate-soil-relief-vegetation model offering the possibility of predicting changes in vegetation liable to occur at any point in the Iberian peninsula's territory, when the climate data values of a site change as compared with data currently estimated. It consequently enables both alterations and sensitivity of potential plant communities to possible climate changes to be detected and predicted at a certain...
This paper presents the links between the climate model IMAGE 2 and the economic model WORLD SCAN, which are set up to obtain an integrated scenario instrument for comprehensive and consistent climate-economy scenarios. The links are made with respect to energy (in WORLD SCAN) and agriculture (in IMAGE 2), thus providing a consistent linkage with feedbacks running both ways.
In 2015, the total amount of water withdrawn for power generation uses in Florida was estimated at 9,859 million gallons per day (Mgal/d). Withdrawals include water used for once-through cooling, cooling pond augmentation, boiler make-up, and domestic uses at power facilities. Saline water accounted for 9,425 Mgal/d of the water withdrawn for power generation, while fresh water accounted for 434 Mgal/d of the water withdrawn for this category. Of the saline water, 9,396 Mgal/d was withdrawn from surface water sources and 29 Mgal/d was withdrawn from groundwater sources. Of the fresh water, 406 Mgal/d was withdrawn from surface water sources and 28 Mgal/d was withdrawn from groundwater sources. Pasco County accounted...
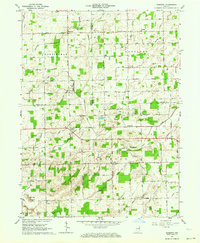
USGS Historical Quadrangle in GeoPDF.

The SARP Flow Alteration Assessment provides a regional characterization of the distribution and risk of flow regime impairment of streams and rivers by anthropogenic sources at the NHD+ segment scale. This map illustrates the cumulative risk of flow alteration (RFA) from surface water use for irrigation in Texas and Oklahoma.  Water use is based on state permits for surface water withdrawals and returns.  The risk is based on the volume of water used monthly in the drainage area relative to the monthly volume of flow.  Risk of Flow Alteration categories:  ZERO     - 0% mean monthly flow depletion,  LOW      - > 0-10%,  MEDIUM - > 10-20%,  HIGH      - >20-100%, and  PROVISIONAL...
The contribution of households to CO 2 production is still increasing. To alter patterns of energy consumption for example with respect to commuter traffic, using the freezer, and warming the house, changing life styles related to domestic energy consumption is considered. In our study, we have operationalized life style as means-end chains, that link perceived benefits of a particular behavior to basic values that people pursue. In this paper, preliminary results are presented of the study that is aimed at empirically establishing the feasibility of the concept of life style in relation to domestic energy consumption.
Total water demand (gallons per day per acre) summarized to 12-digit HUC watersheds was derived from EnviroAtlas agricultural, domestic, industrial, and thermoelectric water demand datasets.Information about the original EPA data is as follows:Agricultural water demand:The EnviroAtlas national water demand metric provides insight into the amount of water currently used for agricultural irrigation in the contiguous United States. The values are based on 2005 irrigation water use; combined 2010 crop, 2006 land use, and 2001 remotely sensed irrigation location estimates; and have been summarized by watershed or 12-digit hydrologic unit code (HUC). Agricultural irrigation water use, as defined in this case, meets a...
|

|
