Filters: Tags: environment (X) > partyWithName: U.S. Geological Survey (X)
3,456 results (58ms)|
Filters
Date Range
Extensions
Types Contacts
Categories
Tag Types
|
Proportion of low and black sagebrush land cover within a 5-km radius developed using a circular focal moving window analysis.
Categories: Data;
Types: Downloadable,
GeoTIFF,
Map Service,
Raster,
Shapefile;
Tags: Artemisia arbuscula,
Artemisia nova,
Colorado,
Idaho,
Montana,
Location of mixed shrubland land cover obtained from the LANDFIRE Existing Vegetation Type dataset.
Categories: Data;
Types: Downloadable,
GeoTIFF,
Map Service,
Raster;
Tags: Colorado,
Idaho,
Montana,
United States,
Utah,
Development of oil and gas wells leads to the destruction and fragmentation of natural habitat. Oil and gas wells also increase noise levels which has been shown to be detrimental to some wildlife species. Therefore, the density of oil and gas wells in the western United States was modeled based on data obtained from the National Oil and Gas Assessment.
Categories: Data;
Types: Downloadable,
GeoTIFF,
Map Service,
Raster;
Tags: Arizona,
California,
Colorado,
Conservation Assessment,
Idaho,
This dataset contains reflectance and transmission spectra of unexpanded and expanded vermiculite ore, and handpicked flakes of phlogopite, hydrobiotite, and vermiculite. These samples were collected from mines near Enoree, South Carolina; Libby, Montana; Louisa, Virginia; Palabora, Llano, Texas; and South Africa. Spectra are identified as either reflectance or transmission in the alphanumeric file names and correlate to specpr record numbers designated in the manuscript figures in which they are shown. These transmission spectra were converted to absorbance in many of the figures. Spectra of talc, fibrous richterite amphibole, and serpentine are from well characterized samples from Feiser Mine, Ruby Mountains,...
The glacial aquifer system of the United States encompasses all or parts of 25 states and is the most widely used supply of drinking water in the Nation (Maupin and Barber, 2005; Maupin and Arnold, 2010). A series of seven raster data sets were derived from a database of water-well drillers' records that was compiled in partial fulfillment of the goals of the U.S. Geological Survey’s Groundwater Availability and Use assessment program (U.S. Geological Survey, 2002). They contain hydrogeologic information for areas of the U.S. that are north of the southern limit of Pleistocene glaciation, including the total thickness of glacial deposits, thickness of coarse-grained sediment within the glacial deposits, specific-capacity...
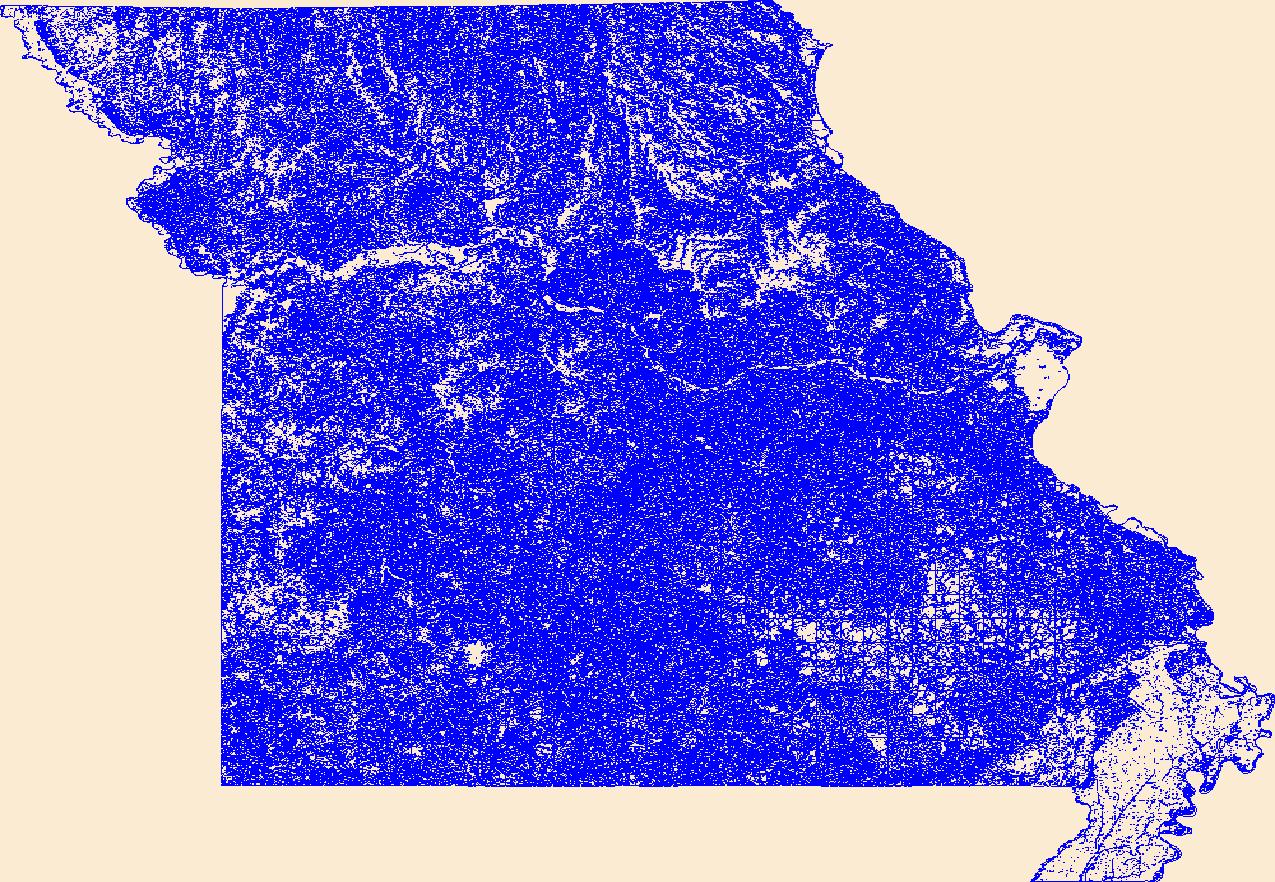
Geospatial data that is a derivative land cover product depicting woodland on topographic maps.
This release contains Active Layer Thickness (ALT) and Organic Layer Thickness (OLT) measurements measured along transects in Alaska, 2015. Site condition information in terms of wildfire burns is also included.
Categories: Data;
Types: Citation;
Tags: Active layer,
Active layer thickness,
Alaska,
Borehole nuclear magnetic resonance,
Chatanika,
Density of all roads within a 5-km radius developed using a circular focal moving window analysis.
Categories: Data;
Types: Downloadable,
GeoTIFF,
Map Service,
Raster;
Tags: Colorado,
Idaho,
Montana,
United States,
Utah,
Proportion of all sagebrush species land cover within a 1-km radius developed using a circular focal moving window analysis.
Categories: Data;
Types: Downloadable,
GeoTIFF,
Map Service,
Raster;
Tags: Artemisia spp.,
Colorado,
Idaho,
Montana,
United States,
Proportion of salt desert shrub land cover within a 1-km radius developed using a circular focal moving window analysis.

Geospatial data that is a derivative land cover product depicting woodland on topographic maps.
The glacial aquifer system of the United States encompasses all or parts of 25 states and is the most widely used supply of drinking water in the Nation (Maupin and Barber, 2005; Maupin and Arnold, 2010). A series of seven raster data sets were derived from a database of water-well drillers' records that was compiled in partial fulfillment of the goals of the U.S. Geological Survey’s Groundwater Availability and Use assessment program (U.S. Geological Survey, 2002). They contain hydrogeologic information for areas of the U.S. that are north of the southern limit of Pleistocene glaciation, including the total thickness of glacial deposits, thickness of coarse-grained sediment within the glacial deposits, specific-capacity...
This dataset contains field measurements of lakebed groundwater temperatures collected during three surveys in July 2008, August 2014, and August 2015, by using a handheld thermocouple probe and GPS at a permeable reactive barrier at Ashumet Pond, Falmouth, MA. The comma-separated file includes unique site identifiers, locations of measurement points, temperatures, dates, and types of measurement (groundwater, surface water, or control). Also included are ESRI raster datasets for each measurement date for (1) interpolated lakebed groundwater temperatures, and (2) interpolated lakebed groundwater temperatures normalized to the surface water temperature at the time of measurement. This data release is provided...
Proportion of juniper land cover within a 18-km radius developed using a circular focal moving window analysis.
Categories: Data;
Types: Downloadable,
GeoTIFF,
Map Service,
Raster,
Shapefile;
Tags: Colorado,
Idaho,
Juniperus,
Montana,
United States,
The central Platte River Valley represents a key mid-latitude stopover This dataset supports a contemporary analysis of nocturnal roost selection for sandhill cranes staging along the Platte River during 2003-2007. We explored variation in selection for previously established characteristics of roost sites, including river channel width, vegetation height along the river bank, and distance to nearest disturbance feature. This analysis also included novel environmental factors (yearly estimates of corn near roost sites, nightly temperature, wind speed, and river discharge) and how they may interact with the more established characteristics.
Categories: Data;
Types: Citation;
Tags: animal tracking,
biota,
birds,
environment,
fUS31 = Nebraska,
Sagebrush ecosystems in North America have experienced extensive degradation since European settlement, and continue to further degrade from exotic invasive plants, greater fire frequency, intensive grazing practices, increased oil and gas development, climate change, and other factors. Remote sensing is often identified as a key information source to facilitate broad-area ecosystem-wide characterization, monitoring and analysis, however, approaches that characterize sagebrush with sufficient and accurate local detail across large areas to support ecosystem research and analysis are unavailable. We have developed a new remote sensing sagebrush ecosystem characterization approach for the state of Wyoming, U.S.A....
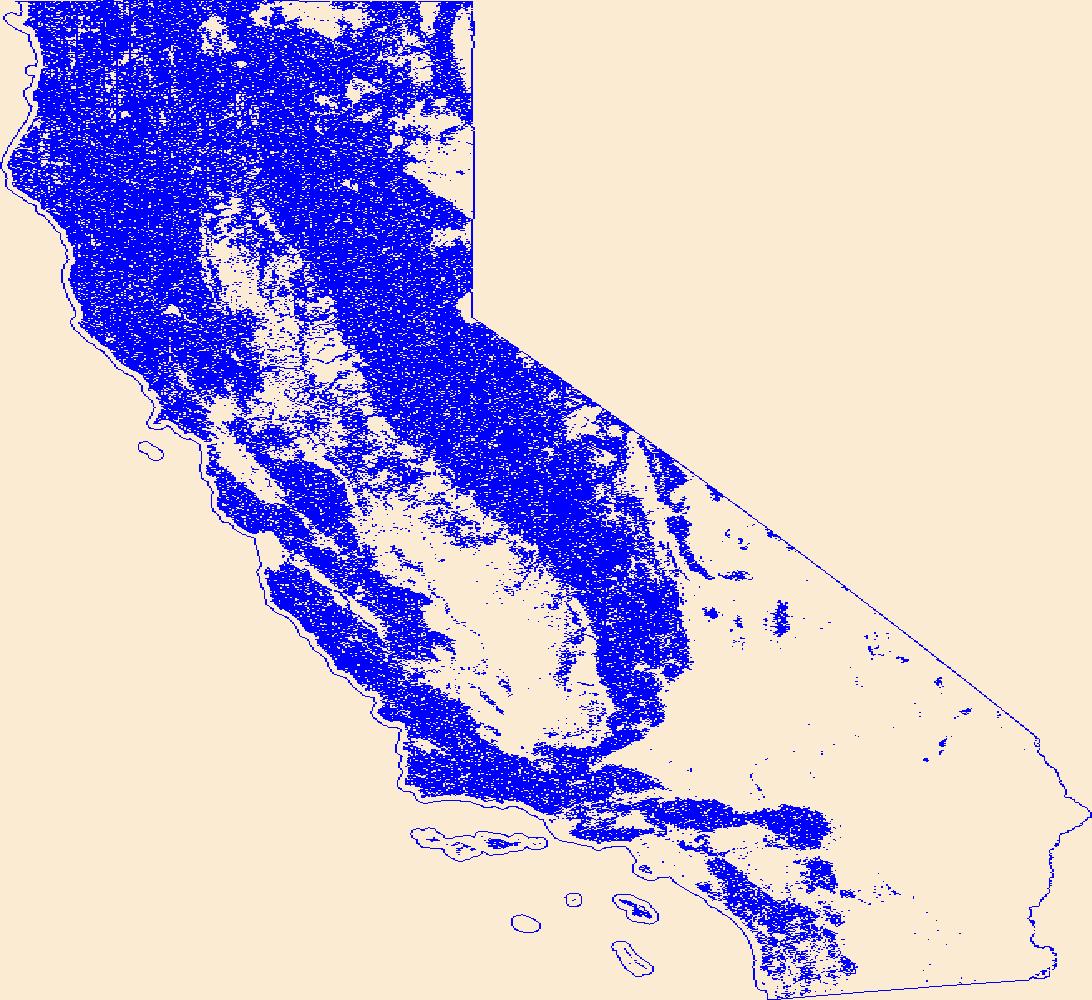
Geospatial data that is a derivative land cover product depicting woodland on topographic maps.
Proportion of grassland land cover within a 5-km radius developed using a circular focal moving window analysis.
Categories: Data;
Types: Downloadable,
GeoTIFF,
Map Service,
Raster;
Tags: Colorado,
Idaho,
Montana,
United States,
Utah,
This Benthic Invertebrate Community Analysis dataset, a conceptual subgroup of the Lake Erie Ecological Investigations (LEEI) dataset, focuses on the benthic invertebrates sampled at Areas of Concern (AOCs) on Lake Erie. Per the Quality Assurance Project Plan (QAPP), the invertebrate samples were taken from sediments remaining from the sediment analysis. Identification of the invertebrates was completed by the same invertebrate taxonomist for both the 1998-2000 evaluation and 1986-87 historical evaluation (Smith et al. 1994) for increased consistency. Oligochaetes were identified to species if possible, chironomids were identified to genus, as adult specimens are needed for specific identification, and other taxa...
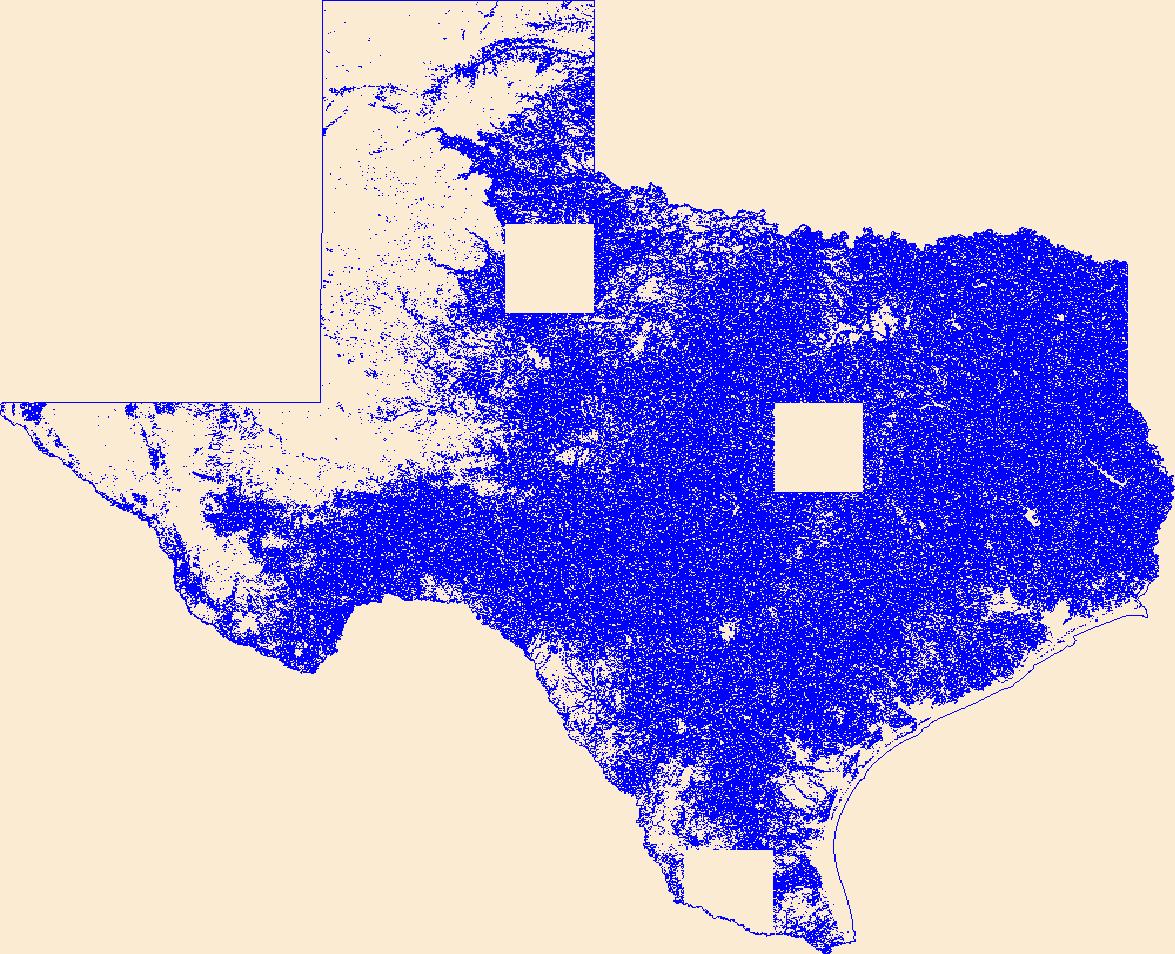
Geospatial data that is a derivative land cover product depicting woodland on topographic maps.
|

|
