Filters: Tags: fire (X)
2,247 results (131ms)|
Filters
Date Range
Extensions Types
Contacts
Categories Tag Types
|
Historical disturbance regimes are often considered a critical element in maintaining native plant communities. However, the response of plant communities to disturbance may be fundamentally altered as a consequence of invasive plants, climate change, or prior disturbances. The appropriateness of historical disturbance patterns under modern conditions and the interactions among disturbances are issues that ecologists must address to protect and restore native plant communities. We evaluated the response of Artemisia tridentata ssp. wyomingensis (Beetle & A. Young) S.L. Welsh plant communities to their historical disturbance regime compared to other disturbance regimes. The historical disturbance regime of these...

This map represents the change between 1971-2000 and 2070-2099 in the mean annual fraction of each gridcell affected by fire, as simulated by the model MC1 under the Hadley future climate projection and A2 anthropogenic emissions scenario. Data values are calculated as PART_BURN(2070-2099) minus PART_BURN(1971-2000). PART_BURN data is from MC1 version B60. The average annual fraction of cell burned for the respective 30-year periods increased in some of the 5,311 grid cells of the Apache-Sitgreaves study area and decreased in others. The range of data values is from -0.077 to +0.163. The mean value is +0.031. The vegetation model MC1 (e.g. Bachelet et al. 2001) was used to simulate vegetation dynamics, associated...
Desert grasslands, which are very sensitive to external drivers like climate change, are areas affected by rapid land degradation processes. In many regions of the world the common form of land degradation involves the rapid encroachment of woody plants into desert grasslands. This process, thought to be irreversible and sustained by biophysical feedbacks of global desertification, results in the heterogeneous distribution of vegetation and soil resources. Most of these shrub-grass transition systems at the desert margins are prone to disturbances such as fires, which affect the interactions between ecological, hydrological, and land surface processes. Here we investigate the effect of prescribed fires on the landscape...
Categories: Publication;
Types: Citation,
Journal Citation;
Tags: Ecosystems,
Springer New York,
drylands,
fire,
land degradation,
The MAPSS team together with long-time collaborator Chris Daly of the Spatial Climate Analysis Service is using Daly's PRISM model to produce high-resolution data grids of observed fire weather. The PRISM model produces interpolations of weather station data that are sensitive to topography, which is especially important in the complex, fire-prone terrain of the mountainous West. Input station data are gathered primarily from the National Weather Service (NWS) Cooperative Observer Program (COOP) and U.S. Department of Agriculture-Natural Resources Conservation Service (USDA-NRCS) SNOTEL networks. For mapped examples of the PRISM-generated historical weather data grids see the Spatial Climate Analysis Service's Web...

The Palmer Drought Severity Index (PDSI) is a measure of drought derived from both precipitation and temperature. Negative (i.e., dry) values of PDSI are closely associated with a high potential for wildland fire. PDSI is based on a supply-and-demand model of soil moisture originally developed by Wayne Palmer, who published his method in the 1965 paper Meteorological Drought for the Office of Climatology of the U.S. Weather Bureau.The index has proven to be most effective in indicating long-term drought (or wetness) over a matter of several months. PDSI calculations are standardized for an individual station (or grid cell) based on the long-term variability of precipitation and temperature at that location....

The integrity of Amazon forests are currently threatened by climate change, deforestation, and fire. However, it is unclear how these agents of change interact over large spatial and temporal domains and reducing this uncertainty is important for projecting changes in carbon stocks and species biogeography, and could better inform continental scale conservation programs. With this in mind, aboveground biomass and tree cover data were produced using the dynamic global vegetation model, LPJmL, with 9 different global climate models (using the SRES A2 emissions storyline) and 2 different deforestation scenarios (from Soares et al.). The existing fire module was modified to include 'escaped fire' associated with deforestation,...

The Standardized Precipitation Index (SPI) is a probability index that can be calculated for different time periods to indicate periods of abnormal wetness or dryness. SPI is derived solely from monthly precipitation and can be compared across regions with different climates. The SPI is an index based on the probability of recording a given amount of precipitation, and the probabilities are standardized so that an index of zero indicates the median precipitation amount (half of the historical precipitation amounts are below the median, and half are above the median). This dataset shows the average 12-month SPI (in classes ranging from extremely wet to extremely dry) for the three-month forecast period indentified...

This map represents the percent change in total ecosystem carbon from 1971-2000 to 2070-2099, simulated by the model MC1 under the Hadley future climate projection and A2 anthropogenic emissions scenario. The average annual value of total ecosystem carbon for the respective 30-year periods decreased in some of the 5,311 grid cells of the Eastern Oregon study area and increased in others.The range of data values is from -18.2% to +194.1%. The mean value is -78.0% The vegetation model MC1 (e.g. Bachelet et al. 2001) was used to simulate vegetation dynamics, associated carbon and nitrogen cycle, water budget, and wild fire impacts at two study sites, one in eastern Oregon (Deschutes and Fremont-Winema National Forests)...

This map represents the difference in annual minimum temperatures, simulated by the model MC1 between the 30-year periods 1971-2000 and 2070-2099, using the Hadley future climate projection under the A2 anthropogenic emission scenario. The average annual minimum temperature for the respective 30-year periods increased in all of the 5,311 grid cells of the Apache-Sitgreaves study area. The greatest increase was 4.35 C; the least increase was 4.26 C; and the mean increase was 4.31 C. The vegetation model MC1 (e.g. Bachelet et al. 2001) was used to simulate vegetation dynamics, associated carbon and nitrogen cycle, water budget, and wild fire impacts at two study sites in eastern Oregon (Deschutes and Fremont-Winema...

The Standardized Precipitation Index (SPI) is a probability index that can be calculated for different time periods to indicate periods of abnormal wetness or dryness. SPI is derived solely from monthly precipitation and can be compared across regions with different climates. The SPI is an index based on the probability of recording a given amount of precipitation, and the probabilities are standardized so that an index of zero indicates the median precipitation amount (half of the historical precipitation amounts are below the median, and half are above the median). This dataset shows the average 12-month SPI (in classes ranging from extremely wet to extremely dry) for the three-month forecast period indentified...

The Standardized Precipitation Index (SPI) is a probability index that can be calculated for different time periods to indicate periods of abnormal wetness or dryness. SPI is derived solely from monthly precipitation and can be compared across regions with different climates. The SPI is an index based on the probability of recording a given amount of precipitation, and the probabilities are standardized so that an index of zero indicates the median precipitation amount (half of the historical precipitation amounts are below the median, and half are above the median). This dataset shows the average 12-month SPI (in classes ranging from extremely wet to extremely dry) for the three-month forecast period indentified...

This map represents the mean for the 30 year period 1971-2000 of the annual peak value of the fraction of live vegetation carbon which is in herbaceous (as opposed to woody) vegetation. The data is from output variable GFRAC in MC1 version B60. The data values are unitless fractions and range from 0 to 1. The vegetation model MC1 (e.g. Bachelet et al. 2001) was used to simulate vegetation dynamics, associated carbon and nitrogen cycle, water budget, and wild fire impacts at two study sites in eastern Oregon (Deschutes and Fremont-Winema National Forests) and in Arizona (Apache Sitgreaves National Forest area) in the context of a project funded by the USDA Forest Service (PNW 09-JV-11261900-003). Historical climate...

This dataset shows the predicted area of high fire potential for the current year up to the end of the forecast period as simulated by a modified version of the MC1 Dynamic General Vegetation Model (DGVM). The area of high fire potential is where PDSI and MC1-calculated values of potential fire behavior (fireline intensity for forest and shrubland and rate of spread of spread for grassland) exceed calibrated threshold values. Potential fire behavior in MC1 is estimated using National Fire Danger Rating System (NFDRS) formulas, monthly climatic (temperature, precipitation, and relative humidity) data, and fuel moisture and loading estimates. Monthly climatic data includes recorded values up to the last observed...

Dynamic map service for GeoMAC application

The integrity of Amazon forests are currently threatened by climate change, deforestation, and fire. However, it is unclear how these agents of change interact over large spatial and temporal domains and reducing this uncertainty is important for projecting changes in carbon stocks and species biogeography, and could better inform continental scale conservation programs. With this in mind, aboveground biomass and tree cover data were produced using the dynamic global vegetation model, LPJmL, with 9 different global climate models (using the SRES A2 emissions storyline) and 2 different deforestation scenarios (from Soares et al.). The existing fire module was modified to include 'escaped fire' associated with deforestation,...

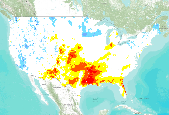
This map shows the predicted area of high fire potential for the current year up to the end of the forecast period as simulated by a modified version of the MC1 Dynamic General Vegetation Model (DGVM). Different colors indicate the level of consensus among five different MC1 simulations (i.e., one for each forecast provided by five different weather models), ranging from one of five to five of five simulations predicting high fire potential. The area of high fire potential is where PDSI and MC1-calculated values of potential fire behavior (fireline intensity for forest and shrubland and rate of spread of spread for grassland) exceed calibrated threshold values. Potential fire behavior in MC1 is estimated using...

The Standardized Precipitation Index (SPI) is a probability index that can be calculated for different time periods to indicate periods of abnormal wetness or dryness. SPI is derived solely from monthly precipitation and can be compared across regions with different climates. The SPI is an index based on the probability of recording a given amount of precipitation, and the probabilities are standardized so that an index of zero indicates the median precipitation amount (half of the historical precipitation amounts are below the median, and half are above the median). This dataset shows the average 12-month SPI (in classes ranging from extremely wet to extremely dry) for the three-month forecast period indentified...

The integrity of Amazon forests are currently threatened by climate change, deforestation, and fire. However, it is unclear how these agents of change interact over large spatial and temporal domains and reducing this uncertainty is important for projecting changes in carbon stocks and species biogeography, and could better inform continental scale conservation programs. With this in mind, above ground biomass and tree cover data were produced using the dynamic global vegetation model, LPJmL, with 9 different global climate models (using the SRES A2 emissions storyline) and 2 different deforestation scenarios (from Soares et al.). The existing fire module was modified to include 'escaped fire' associated with deforestation,...

The integrity of Amazon forests are currently threatened by climate change, deforestation, and fire. However, it is unclear how these agents of change interact over large spatial and temporal domains and reducing this uncertainty is important for projecting changes in carbon stocks and species biogeography, and could better inform continental scale conservation programs. With this in mind, aboveground biomass and tree cover data were produced using the dynamic global vegetation model, LPJmL, with 9 different global climate models (using the SRES A2 emissions storyline) and 2 different deforestation scenarios (from Soares et al.). The existing fire module was modified to include 'escaped fire' associated with deforestation,...

The integrity of Amazon forests are currently threatened by climate change, deforestation, and fire. However, it is unclear how these agents of change interact over large spatial and temporal domains and reducing this uncertainty is important for projecting changes in carbon stocks and species biogeography, and could better inform continental scale conservation programs. With this in mind, aboveground biomass and tree cover data were produced using the dynamic global vegetation model, LPJmL, with 9 different global climate models (using the SRES A2 emissions storyline) and 2 different deforestation scenarios (from Soares et al.). The existing fire module was modified to include 'escaped fire' associated with deforestation,...
|

|
