Filters: Tags: fish (X) > partyWithName: Conservation Biology Institute (X)
153 results (23ms)|
Filters
Date Range
Tag Schemes |

Oregon Fish Habitat Distribution These data describe areas of suitable habitat believed to be used currently by wild, natural, and/or hatchery fish populations. The term "currently" is defined as within the past five reproductive cycles. This information is based on sampling, the best professional opinion of Oregon Dept. of Fish and Wildlife or other natural resources agency staff biologists or modeling (see the fhdBasis field). Due to natural variations in run size, water conditions, or other environmental factors, some habitats identified may not be used annually. These data now comply with the Oregon Fish Habitat Distribution Data Standard that was adopted by the Oregon Geographic Information Council in...

These GIS data contain stream reaches that were designated as "critical habitat" for the Lower Columbia River (LCR) steelhead Evolutionarily Significant Unit (ESU). The critical habitat is defined in the National Marine Fisheries Service's (NOAA Fisheries) final rule to designate critical habitat for 12 ESUs of Pacific salmon and steelhead. The fish distribution in this data set was compiled from data gathered from the Idaho Department of Fish and Game (IDFG), Oregon Department of Fish and Wildlife (ODFW) and the Washington Department of Fish and Wildlife (WDFW). Additionally, we received comments from the public, federal agencies, and state and tribal salmon co-managers during the rule making process. A detailed...

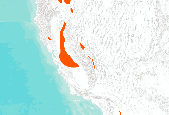
The source of this coverage data set is the fish biodiversity maps created for The Nature Conservancy (TNC) as part of their Hexagon Project. Professor Peter Moyle and his graduate student, Paul Randall, of the Department of Wildlife and Fisheries Conservation Biology at the University of California, Davis were hired to produce range maps for all known fish species that presently occur in California. Each coverage denotes a separate fish species (refer to the species coverage key below). The polygons are estimated to be accurate at a scale of roughly 1:1,000,000. Other California fish species distributions can be found in a gallery at: http://app.databasin.org/app/pages/galleryPage.jsp?id=099b47b7394f47b6b42764829e8a8f09

Species occurrence data were obtained from the Atlas of Spawning and Nursery Areas of Great Lakes Fishes (Goodyear et al. 1982). The atlas contains information on all of the commercially and recreationally important species that use the tributaries, littoral and open-water areas of the Great Lakes as spawning and nursery habitats. Close to 9500 geo-referenced data records (occurrences of fish species) were imported into ArcView GIS. The 139 fish taxa reported in the Atlas had to be grouped into fewer broad categories to produce meaningful distribution maps. We chose three functional classification schemes. Jude and Pappas (1992) used Correspondence Analysis to partition fish species associated with the open...

Species occurrence data were obtained from the Atlas of Spawning and Nursery Areas of Great Lakes Fishes (Goodyear et al. 1982). The atlas contains information on all of the commercially and recreationally important species that use the tributaries, littoral and open-water areas of the Great Lakes as spawning and nursery habitats. Close to 9500 geo-referenced data records (occurrences of fish species) were imported into ArcView GIS. The 139 fish taxa reported in the Atlas had to be grouped into fewer broad categories to produce meaningful distribution maps. We chose three functional classification schemes. Jude and Pappas (1992) used Correspondence Analysis to partition fish species associated with the open...

The source of this coverage data set is the fish biodiversity maps created for The Nature Conservancy (TNC) as part of their Hexagon Project. Professor Peter Moyle and his graduate student, Paul Randall, of the Department of Wildlife and Fisheries Conservation Biology at the University of California, Davis were hired to produce range maps for all known fish species that presently occur in California. Each coverage denotes a separate fish species (refer to the species coverage key below). The polygons are estimated to be accurate at a scale of roughly 1:1,000,000. Other California fish species distributions can be found in a gallery at: http://app.databasin.org/app/pages/galleryPage.jsp?id=099b47b7394f47b6b42764829e8a8f09

The source of this coverage data set is the fish biodiversity maps created for The Nature Conservancy (TNC) as part of their Hexagon Project. Professor Peter Moyle and his graduate student, Paul Randall, of the Department of Wildlife and Fisheries Conservation Biology at the University of California, Davis were hired to produce range maps for all known fish species that presently occur in California. Each coverage denotes a separate fish species (refer to the species coverage key below). The polygons are estimated to be accurate at a scale of roughly 1:1,000,000. Other California fish species distributions can be found in a gallery at: http://app.databasin.org/app/pages/galleryPage.jsp?id=099b47b7394f47b6b42764829e8a8f09

The source of this coverage data set is the fish biodiversity maps created for The Nature Conservancy (TNC) as part of their Hexagon Project. Professor Peter Moyle and his graduate student, Paul Randall, of the Department of Wildlife and Fisheries Conservation Biology at the University of California, Davis were hired to produce range maps for all known fish species that presently occur in California. Each coverage denotes a separate fish species (refer to the species coverage key below). The polygons are estimated to be accurate at a scale of roughly 1:1,000,000. Other California fish species distributions can be found in a gallery at: http://app.databasin.org/app/pages/galleryPage.jsp?id=099b47b7394f47b6b42764829e8a8f09

The source of this coverage data set is the fish biodiversity maps created for The Nature Conservancy (TNC) as part of their Hexagon Project. Professor Peter Moyle and his graduate student, Paul Randall, of the Department of Wildlife and Fisheries Conservation Biology at the University of California, Davis were hired to produce range maps for all known fish species that presently occur in California. Each coverage denotes a separate fish species (refer to the species coverage key below). The polygons are estimated to be accurate at a scale of roughly 1:1,000,000. Other California fish species distributions can be found in a gallery at: http://app.databasin.org/app/pages/galleryPage.jsp?id=099b47b7394f47b6b42764829e8a8f09

The source of this coverage data set is the fish biodiversity maps created for The Nature Conservancy (TNC) as part of their Hexagon Project. Professor Peter Moyle and his graduate student, Paul Randall, of the Department of Wildlife and Fisheries Conservation Biology at the University of California, Davis were hired to produce range maps for all known fish species that presently occur in California. Each coverage denotes a separate fish species (refer to the species coverage key below). The polygons are estimated to be accurate at a scale of roughly 1:1,000,000. Other California fish species distributions can be found in a gallery at: http://app.databasin.org/app/pages/galleryPage.jsp?id=099b47b7394f47b6b42764829e8a8f09

The source of this coverage data set is the fish biodiversity maps created for The Nature Conservancy (TNC) as part of their Hexagon Project. Professor Peter Moyle and his graduate student, Paul Randall, of the Department of Wildlife and Fisheries Conservation Biology at the University of California, Davis were hired to produce range maps for all known fish species that presently occur in California. Each coverage denotes a separate fish species (refer to the species coverage key below). The polygons are estimated to be accurate at a scale of roughly 1:1,000,000. Other California fish species distributions can be found in a gallery at: http://app.databasin.org/app/pages/galleryPage.jsp?id=099b47b7394f47b6b42764829e8a8f09

The source of this coverage data set is the fish biodiversity maps created for The Nature Conservancy (TNC) as part of their Hexagon Project. Professor Peter Moyle and his graduate student, Paul Randall, of the Department of Wildlife and Fisheries Conservation Biology at the University of California, Davis were hired to produce range maps for all known fish species that presently occur in California. Each coverage denotes a separate fish species (refer to the species coverage key below). The polygons are estimated to be accurate at a scale of roughly 1:1,000,000. Other California fish species distributions can be found in a gallery at: http://app.databasin.org/app/pages/galleryPage.jsp?id=099b47b7394f47b6b42764829e8a8f09

The source of this coverage data set is the fish biodiversity maps created for The Nature Conservancy (TNC) as part of their Hexagon Project. Professor Peter Moyle and his graduate student, Paul Randall, of the Department of Wildlife and Fisheries Conservation Biology at the University of California, Davis were hired to produce range maps for all known fish species that presently occur in California. Each coverage denotes a separate fish species (refer to the species coverage key below). The polygons are estimated to be accurate at a scale of roughly 1:1,000,000. Other California fish species distributions can be found in a gallery at: http://app.databasin.org/app/pages/galleryPage.jsp?id=099b47b7394f47b6b42764829e8a8f09

Point locations for collections of Michigan fish in the Lake Michigan basin.

Species occurrence data were obtained from the Atlas of Spawning and Nursery Areas of Great Lakes Fishes (Goodyear et al. 1982). The atlas contains information on all of the commercially and recreationally important species that use the tributaries, littoral and open-water areas of the Great Lakes as spawning and nursery habitats. Close to 9500 geo-referenced data records (occurrences of fish species) were imported into ArcView GIS. The 139 fish taxa reported in the Atlas had to be grouped into fewer broad categories to produce meaningful distribution maps. We chose three functional classification schemes. Jude and Pappas (1992) used Correspondence Analysis to partition fish species associated with the open...

The source of this coverage data set is the fish biodiversity maps created for The Nature Conservancy (TNC) as part of their Hexagon Project. Professor Peter Moyle and his graduate student, Paul Randall, of the Department of Wildlife and Fisheries Conservation Biology at the University of California, Davis were hired to produce range maps for all known fish species that presently occur in California. Each coverage denotes a separate fish species (refer to the species coverage key below). The polygons are estimated to be accurate at a scale of roughly 1:1,000,000. Other California fish species distributions can be found in a gallery at: http://app.databasin.org/app/pages/galleryPage.jsp?id=099b47b7394f47b6b42764829e8a8f09

The source of this coverage data set is the fish biodiversity maps created for The Nature Conservancy (TNC) as part of their Hexagon Project. Professor Peter Moyle and his graduate student, Paul Randall, of the Department of Wildlife and Fisheries Conservation Biology at the University of California, Davis were hired to produce range maps for all known fish species that presently occur in California. Each coverage denotes a separate fish species (refer to the species coverage key below). The polygons are estimated to be accurate at a scale of roughly 1:1,000,000. Other California fish species distributions can be found in a gallery at: http://app.databasin.org/app/pages/galleryPage.jsp?id=099b47b7394f47b6b42764829e8a8f09

The source of this coverage data set is the fish biodiversity maps created for The Nature Conservancy (TNC) as part of their Hexagon Project. Professor Peter Moyle and his graduate student, Paul Randall, of the Department of Wildlife and Fisheries Conservation Biology at the University of California, Davis were hired to produce range maps for all known fish species that presently occur in California. Each coverage denotes a separate fish species (refer to the species coverage key below). The polygons are estimated to be accurate at a scale of roughly 1:1,000,000. Other California fish species distributions can be found in a gallery at: http://app.databasin.org/app/pages/galleryPage.jsp?id=099b47b7394f47b6b42764829e8a8f09

The source of this coverage data set is the fish biodiversity maps created for The Nature Conservancy (TNC) as part of their Hexagon Project. Professor Peter Moyle and his graduate student, Paul Randall, of the Department of Wildlife and Fisheries Conservation Biology at the University of California, Davis were hired to produce range maps for all known fish species that presently occur in California. Each coverage denotes a separate fish species (refer to the species coverage key below). The polygons are estimated to be accurate at a scale of roughly 1:1,000,000. Other California fish species distributions can be found in a gallery at: http://app.databasin.org/app/pages/galleryPage.jsp?id=099b47b7394f47b6b42764829e8a8f09
The source of this coverage data set is the fish biodiversity maps created for The Nature Conservancy (TNC) as part of their Hexagon Project. Professor Peter Moyle and his graduate student, Paul Randall, of the Department of Wildlife and Fisheries Conservation Biology at the University of California, Davis were hired to produce range maps for all known fish species that presently occur in California. Each coverage denotes a separate fish species (refer to the species coverage key below). The polygons are estimated to be accurate at a scale of roughly 1:1,000,000. Other California fish species distributions can be found in a gallery at: http://app.databasin.org/app/pages/galleryPage.jsp?id=099b47b7394f47b6b42764829e8a8f09
|

|
