Filters
Date Range
Extensions
Types
Contacts
Categories
Tag Types
Tag Schemes
|
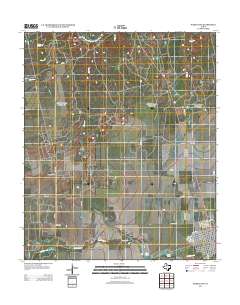
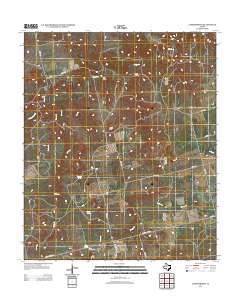
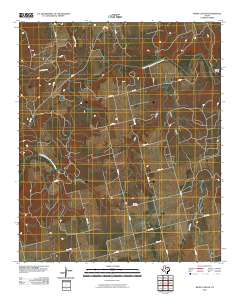
This data set contains imagery from the National Agriculture Imagery Program (NAIP). The NAIP program is administered by USDA FSA and has been established to support two main FSA strategic goals centered on agricultural production. These are increase stewardship of America's natural resources while enhancing the environment, and to ensure commodities are procured and distributed effectively and efficiently to increase food security. The NAIP program supports these goals by acquiring and providing ortho imagery that has been collected during the agricultural growing season in the U.S. The NAIP ortho imagery is tailored to meet FSA requirements and is a fundamental tool used to support FSA farm and conservation programs....
Types: Citation;
Tags: 3.75 x 3.75 minute,
3210020,
48151,
Aerial Compliance,
BULL CREEK, All tags...
BULL CREEK, NE,
Compliance,
Digital Ortho rectified Image,
Downloadable Data,
FISHER CO TX FSA,
Fisher,
JPEG 2000,
JPEG2000,
NAIP,
Ortho Rectification,
Orthoimagery,
Quarter Quadrangle,
TX,
TX151,
USDA National Agriculture Imagery Program (NAIP),
farming,
imageryBaseMapsEarthCover, Fewer tags
This data set contains imagery from the National Agriculture Imagery Program (NAIP). The NAIP program is administered by USDA FSA and has been established to support two main FSA strategic goals centered on agricultural production. These are increase stewardship of America's natural resources while enhancing the environment, and to ensure commodities are procured and distributed effectively and efficiently to increase food security. The NAIP program supports these goals by acquiring and providing ortho imagery that has been collected during the agricultural growing season in the U.S. The NAIP ortho imagery is tailored to meet FSA requirements and is a fundamental tool used to support FSA farm and conservation programs....
Types: Citation;
Tags: 3.75 x 3.75 minute,
3210028,
48151,
Aerial Compliance,
BERNECKER, All tags...
BERNECKER, NW,
Compliance,
Digital Ortho rectified Image,
Downloadable Data,
FISHER CO TX FSA,
Fisher,
JPEG 2000,
JPEG2000,
NAIP,
Ortho Rectification,
Orthoimagery,
Quarter Quadrangle,
TX,
TX151,
USDA National Agriculture Imagery Program (NAIP),
farming,
imageryBaseMapsEarthCover, Fewer tags

Fisher potential habitat was defined as any cell with a predicted probability of fisher occurrence > 0.4 in a mosaic created by CBI of 5 fisher probability of occupancy models: Spencer et al. 2008 (southern Sierra Nevada), Zielinski et al. in review (interior northern CA), Davis et al. 2007 (Klamath-Shasta, southern Sierra Nevada, and statewide CA): Davis, F.W., C. Seo, and W.J. Zielinksi. 2007. Regional variation in home-range-scale habitat models for fisher (Martes pennanti ) in California. Ecological Applications. 17:2195-2213. Spencer,W., H. Rustigian-Romsos, J. Strittholt, R. Scheller, W. Zielinski, and R. Truex. 2010. Using occupancy and population models to assess habitat conservation opportunities for...

Predicted probability of fisher year-round occurrence derived from future (2046-2065) climate projections and vegetation simulations. Projected fisher distribution was created with Maxent (Phillips et al. 2006) using fisher detections (N = 302, spanning 1990 – 2011) and five predictor variables: mean annual precipitation, mean summer (July – September) precipitation, mean understory index (fraction of grass vegetation carbon in forest), mean forest carbon (g C m2), and mean fraction of vegetation carbon in forest. Future climate drivers were generated using statistical downscaling (simple delta method) of general circulation model projections, in this case CSIRO Mk3 (Gordon 2002) under the A2 emission scenario...
Tags: california,
climate,
csiro,
fisher,
mammal, All tags...
mc1,
north america,
species distribution model,
usa,
wildlife habitat,
yale, Fewer tags
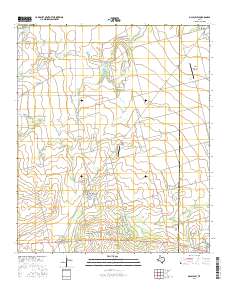
Layered GeoPDF 7.5 Minute Quadrangle Map. Layers of geospatial data include orthoimagery, roads, grids, geographic names, elevation contours, hydrography, and other selected map features.
Tags: 7.5 x 7.5 minute,
Downloadable Data,
EarthCover,
Fisher,
GeoPDF, All tags...
Imagery and Base Maps,
Jones,
Map,
McCaulley, TX,
Public Land Survey System,
Texas,
U.S. National Grid,
US,
US Topo,
US Topo Historical,
United States,
boundary,
contour,
geographic names,
hydrography,
imageryBaseMapsEarthCover,
orthoimage,
structures,
topographic,
transportation,
woodland, Fewer tags
Layered GeoPDF 7.5 Minute Quadrangle Map. Layers of geospatial data include orthoimagery, roads, grids, geographic names, elevation contours, hydrography, and other selected map features.
Tags: 7.5 x 7.5 minute,
Downloadable Data,
EarthCover,
Fisher,
GeoPDF, All tags...
Hamlin NW, TX,
Imagery and Base Maps,
Jones,
Map,
Public Land Survey System,
Stonewall,
Texas,
U.S. National Grid,
US,
US Topo,
US Topo Historical,
United States,
boundary,
contour,
geographic names,
hydrography,
imageryBaseMapsEarthCover,
orthoimage,
structures,
topographic,
transportation,
woodland, Fewer tags
Layered GeoPDF 7.5 Minute Quadrangle Map. Layers of geospatial data include orthoimagery, roads, grids, geographic names, elevation contours, hydrography, and other selected map features.
Tags: 7.5 x 7.5 minute,
Bull Creek, TX,
Downloadable Data,
EarthCover,
Fisher, All tags...
GeoPDF,
Imagery and Base Maps,
Map,
Public Land Survey System,
Texas,
U.S. National Grid,
US,
US Topo,
US Topo Historical,
United States,
boundary,
contour,
geographic names,
hydrography,
imageryBaseMapsEarthCover,
orthoimage,
structures,
topographic,
transportation,
woodland, Fewer tags
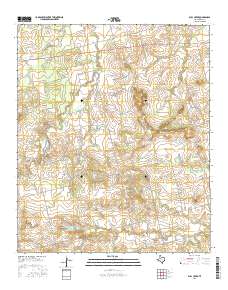
Layered GeoPDF 7.5 Minute Quadrangle Map. Layers of geospatial data include orthoimagery, roads, grids, geographic names, elevation contours, hydrography, and other selected map features.
Tags: 7.5 x 7.5 minute,
Camp Springs, TX,
Downloadable Data,
EarthCover,
Fisher, All tags...
GeoPDF,
Imagery and Base Maps,
Map,
Public Land Survey System,
Scurry,
Texas,
U.S. National Grid,
US,
US Topo,
US Topo Historical,
United States,
boundary,
contour,
geographic names,
hydrography,
imageryBaseMapsEarthCover,
orthoimage,
structures,
topographic,
transportation,
woodland, Fewer tags
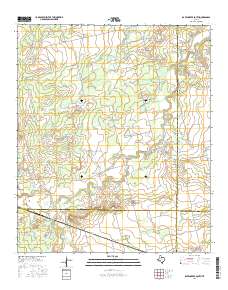
Layered GeoPDF 7.5 Minute Quadrangle Map. Layers of geospatial data include orthoimagery, roads, grids, geographic names, elevation contours, hydrography, and other selected map features.
Tags: 7.5 x 7.5 minute,
Downloadable Data,
EarthCover,
Fisher,
GeoPDF, All tags...
Imagery and Base Maps,
Jones,
Map,
Nolan,
Public Land Survey System,
Raven Creek South, TX,
Taylor,
Texas,
U.S. National Grid,
US,
US Topo,
US Topo Historical,
United States,
boundary,
contour,
geographic names,
hydrography,
imageryBaseMapsEarthCover,
orthoimage,
structures,
topographic,
transportation,
woodland, Fewer tags
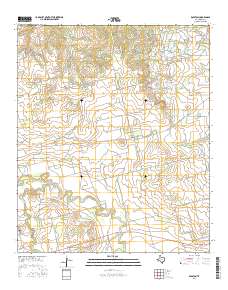
Layered GeoPDF 7.5 Minute Quadrangle Map. Layers of geospatial data include orthoimagery, roads, grids, geographic names, elevation contours, hydrography, and other selected map features.
Tags: 7.5 x 7.5 minute,
Downloadable Data,
EarthCover,
Fisher,
GeoPDF, All tags...
Imagery and Base Maps,
Map,
Public Land Survey System,
Royston, TX,
Texas,
U.S. National Grid,
US,
US Topo,
US Topo Historical,
United States,
boundary,
contour,
geographic names,
hydrography,
imageryBaseMapsEarthCover,
orthoimage,
structures,
topographic,
transportation,
woodland, Fewer tags
Layered GeoPDF 7.5 Minute Quadrangle Map. Layers of geospatial data include orthoimagery, roads, grids, geographic names, elevation contours, hydrography, and other selected map features.
Tags: 7.5 x 7.5 minute,
Downloadable Data,
EarthCover,
Fisher,
GeoPDF, All tags...
Imagery and Base Maps,
Map,
Stonewall,
Texas,
U.S. National Grid,
US,
US Topo,
US Topo Historical,
United States,
White Canyon, TX,
contour,
geographic names,
hydrography,
orthoimage,
topographic,
transportation, Fewer tags
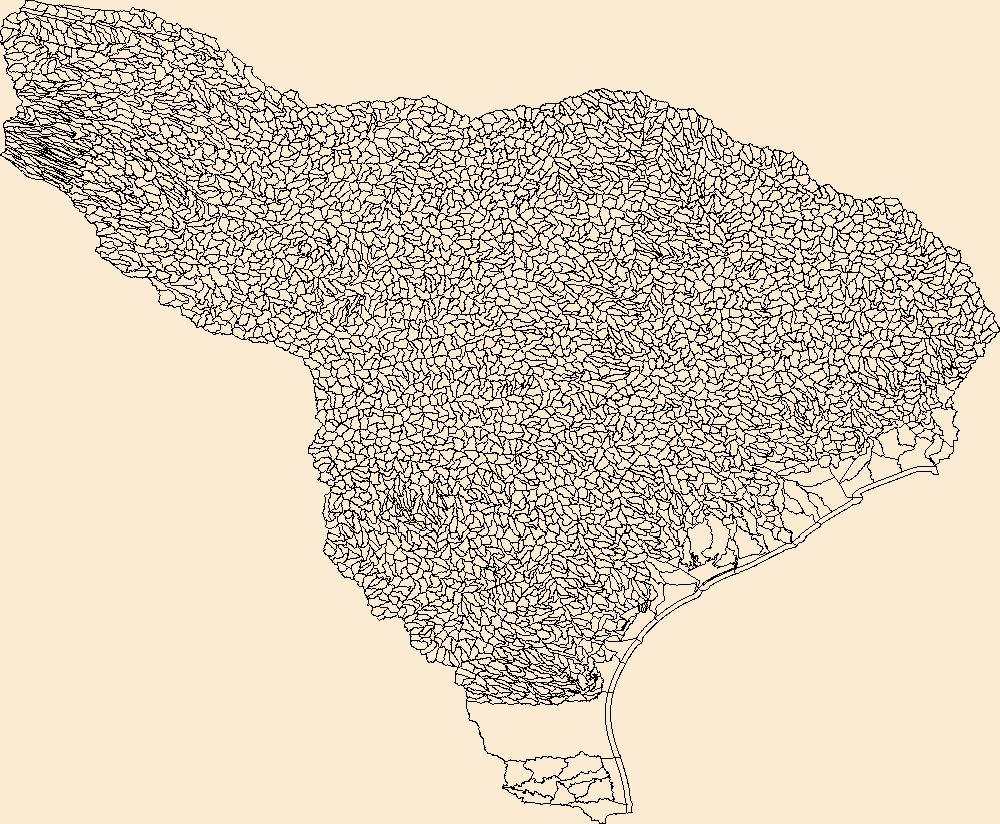
The Watershed Boundary Dataset (WBD) is a comprehensive aggregated collection of hydrologic unit data consistent with the national criteria for delineation and resolution. It defines the areal extent of surface water drainage to a point except in coastal or lake front areas where there could be multiple outlets as stated by the "Federal Standards and Procedures for the National Watershed Boundary Dataset (WBD)" "Standard" (https://pubs.usgs.gov/tm/11/a3/). Watershed boundaries are determined solely upon science-based hydrologic principles, not favoring any administrative boundaries or special projects, nor particular program or agency. This dataset represents the hydrologic unit boundaries to the 12-digit (6th level)...
Tags: 10-digit,
12-digit,
14-digit,
16-digit,
2-digit, All tags...
4-digit,
6-digit,
8-digit,
Anderson,
Andrews,
Angelina,
Aransas,
Archer,
Atascosa,
Austin,
Bailey,
Bandera,
Basin,
Bastrop,
Baylor,
Beauregard,
Bee,
Bell,
Bexar,
Blanco,
Borden,
Bosque,
Brazoria,
Brazos,
Brooks,
Brown,
Burleson,
Burnet,
Caddo,
Calcasieu,
Caldwell,
Calhoun,
Callahan,
Cameron,
Castro,
Chambers,
Chaves,
Cherokee,
Clay,
Cochran,
Coke,
Coleman,
Collin,
Colorado,
Comal,
Comanche,
Concho,
Cooke,
Coryell,
Crockett,
Crosby,
Curry,
Dallas,
Dawson,
De Soto,
DeWitt,
Denton,
Dickens,
Dimmit,
Downloadable Data,
Duval,
Eastland,
Ector,
Edwards,
Ellis,
Erath,
Falls,
Fannin,
Fayette,
Fisher,
Floyd,
Fort Bend,
Franklin,
Freestone,
Frio,
Gaines,
Galveston,
Garza,
GeoPackage,
Gillespie,
Glasscock,
Goliad,
Gonzales,
Grayson,
Gregg,
Grimes,
Guadalupe,
HU-2,
HU-2 Region,
HU2_12,
HUC,
Hale,
Hamilton,
Hardin,
Harris,
Harrison,
Haskell,
Hays,
Henderson,
Hidalgo,
Hill,
Hockley,
Hood,
Hopkins,
Houston,
Howard,
Hunt,
Hydrography,
Hydrologic Unit Code,
Hydrologic Units,
Irion,
Jack,
Jackson,
Jasper,
Jefferson,
Jim Hogg,
Jim Wells,
Johnson,
Jones,
Karnes,
Kaufman,
Kendall,
Kenedy,
Kent,
Kerr,
Kimble,
King,
Kinney,
Kleberg,
Knox,
LA,
La Salle,
Lamb,
Lampasas,
Lavaca,
Lea,
Lee,
Leon,
Liberty,
Limestone,
Live Oak,
Llano,
Louisiana,
Lubbock,
Lynn,
Madison,
Martin,
Mason,
Matagorda,
Maverick,
McCulloch,
McLennan,
McMullen,
Medina,
Menard,
Midland,
Milam,
Mills,
Mitchell,
Montague,
Montgomery,
NM,
Nacogdoches,
Natchitoches,
National Watershed Boundary Dataset (WBD),
National Watershed Boundary Dataset (WBD),
Navarro,
New Mexico,
Newton,
Nolan,
Nueces,
Open Geospatial Consortium GeoPackage 1.2,
Orange,
Palo Pinto,
Panola,
Parker,
Parmer,
Polk,
Rains,
Reagan,
Real,
Refugio,
Region,
Robertson,
Rockwall,
Roosevelt,
Runnels,
Rusk,
Sabine,
San Augustine,
San Jacinto,
San Patricio,
San Saba,
Schleicher,
Scurry,
Shackelford,
Shelby,
Smith,
Somervell,
Starr,
Stephens,
Sterling,
Stonewall,
Sub-basin,
Sub-region,
Subwatershed,
Sutton,
Swisher,
TX,
Tarrant,
Taylor,
Terry,
Texas,
Throckmorton,
Tom Green,
Travis,
Trinity,
Tyler,
US,
United States,
Upshur,
Upton,
Uvalde,
Van Zandt,
Vernon,
Victoria,
WBD,
Walker,
Waller,
Washington,
Watershed,
Watershed Boundary Dataset,
Webb,
Wharton,
Willacy,
Williamson,
Wilson,
Winkler,
Wise,
Wood,
Yoakum,
Young,
Zavala,
inlandWaters, Fewer tags

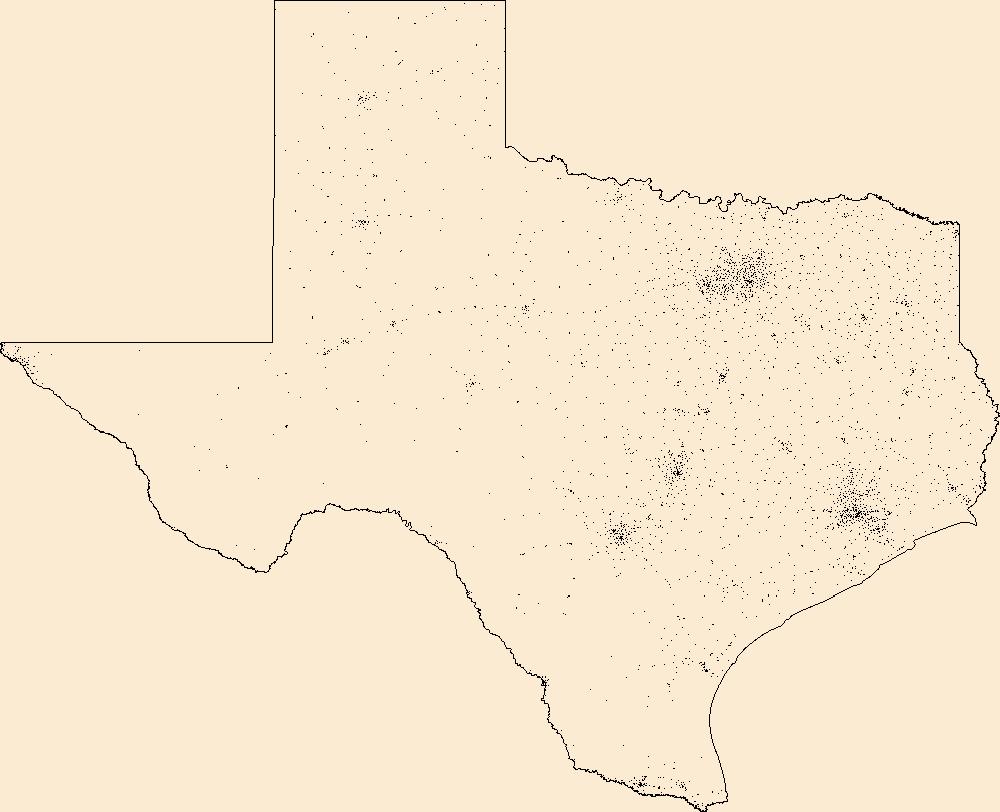
The Geographic Names Information System (GNIS) is the Federal standard for geographic nomenclature. The U.S. Geological Survey developed the GNIS for the U.S. Board on Geographic Names, a Federal inter-agency body chartered by public law to maintain uniform feature name usage throughout the Government and to promulgate standard names to the public. The GNIS is the official repository of domestic geographic names data; the official vehicle for geographic names use by all departments of the Federal Government; and the source for applying geographic names to Federal electronic and printed products of all types.
Tags: Anderson,
Andrews,
Angelina,
Antarctica,
Antarctica, All tags...
Aransas,
Archer,
Armstrong,
Atascosa,
Austin,
BGN,
Bailey,
Bandera,
Bastrop,
Baylor,
Bee,
Bell,
Bexar,
Blanco,
Board on Geographic Names,
Borden,
Borough,
Bosque,
Bowie,
Brazoria,
Brazos,
Brewster,
Briscoe,
Brooks,
Brown,
Burleson,
Burnet,
Caldwell,
Calhoun,
Callahan,
Cameron,
Camp,
Carson,
Cass,
Castro,
Census Area,
Chambers,
Cherokee,
Childress,
Clay,
Cochran,
Coke,
Coleman,
Collin,
Collingsworth,
Colorado,
Comal,
Comanche,
Commonwealth,
Concho,
Cooke,
Coryell,
Cottle,
County,
Crane,
Crockett,
Crosby,
Culberson,
Dallam,
Dallas,
Dawson,
DeWitt,
Deaf Smith,
Delta,
Denton,
Dickens,
Dimmit,
District,
Donley,
Downloadable Data,
Duval,
Eastland,
Ector,
Edwards,
El Paso,
Ellis,
Erath,
Falls,
Fannin,
Fayette,
Feature class,
Feature coordinates,
Feature county,
Feature description,
Feature designation,
Feature history,
Feature indentification,
Feature name,
Feature state,
Fisher,
Floyd,
Foard,
Fort Bend,
Franklin,
Freestone,
Frio,
GNIS,
Gaines,
Galveston,
Garza,
Geographic Names,
Geographic Names Domestic Names,
Geographic Names Information System,
Geographic feature,
Geographic name,
Geographical feature,
Geographical name,
Gillespie,
Glasscock,
Goliad,
Gonzales,
Gray,
Grayson,
Gregg,
Grimes,
Guadalupe,
Hale,
Hall,
Hamilton,
Hansford,
Hardeman,
Hardin,
Harris,
Harrison,
Hartley,
Haskell,
Hays,
Hemphill,
Henderson,
Hidalgo,
Hill,
Hockley,
Hood,
Hopkins,
Houston,
Howard,
Hudspeth,
Hunt,
Hutchinson,
Irion,
Jack,
Jackson,
Jasper,
Jeff Davis,
Jefferson,
Jim Hogg,
Jim Wells,
Johnson,
Jones,
Karnes,
Kaufman,
Kendall,
Kenedy,
Kent,
Kerr,
Kimble,
King,
Kinney,
Kleberg,
Knox,
La Salle,
Lamar,
Lamb,
Lampasas,
Lavaca,
Lee,
Leon,
Liberty,
Limestone,
Lipscomb,
Live Oak,
Llano,
Loving,
Lubbock,
Lynn,
Madison,
Marion,
Martin,
Mason,
Matagorda,
Maverick,
McCulloch,
McLennan,
McMullen,
Medina,
Menard,
Midland,
Milam,
Mills,
Mitchell,
Montague,
Montgomery,
Moore,
Morris,
Motley,
Municipio,
Nacogdoches,
National Geographic Names Information System (GNIS),
National Geographic Names Information System (GNIS),
Navarro,
Newton,
Nolan,
Nueces,
Ochiltree,
Official feature name,
Oldham,
Orange,
Outlying Area,
Palo Pinto,
Panola,
Parish,
Parker,
Parmer,
Pecos,
Place name,
Polk,
Populated Place,
Potter,
Presidio,
Rains,
Randall,
Reagan,
Real,
Red River,
Reeves,
Refugio,
Roberts,
Robertson,
Rockwall,
Runnels,
Rusk,
Sabine,
San Augustine,
San Jacinto,
San Patricio,
San Saba,
Schleicher,
Scurry,
Shackelford,
Shelby,
Sherman,
Smith,
Somervell,
Starr,
State,
Stephens,
Sterling,
Stonewall,
Sutton,
Swisher,
TX,
TXT (pipes),
Tarrant,
Taylor,
Terrell,
Territories,
Territory,
Terry,
Texas,
Throckmorton,
Titus,
Tom Green,
Topographic Map,
Travis,
Trinity,
Tyler,
U.S. Board on Geographic Names,
U.S. Geological Survey,
US,
USA,
USBGN,
USGS,
UTF-8 Pipe Delimited Text File nan,
United States,
United States,
United States,
Upshur,
Upton,
Uvalde,
Val Verde,
Van Zandt,
Variant name,
Victoria,
Walker,
Waller,
Ward,
Washington,
Webb,
Wharton,
Wheeler,
Wichita,
Wilbarger,
Willacy,
Williamson,
Wilson,
Winkler,
Wise,
Wood,
Yoakum,
Young,
Zapata,
Zavala,
antarctic,
database,
economy,
environment,
feature,
gazetteer,
geographic,
geographic names,
geographical,
geography,
geospatial,
imageryBaseMapsEarthCover,
inlandWaters,
location,
map,
name,
place,
placename,
society,
structure,
topographic map,
toponymy, Fewer tags
The Geographic Names Information System (GNIS) is the Federal standard for geographic nomenclature. The U.S. Geological Survey developed the GNIS for the U.S. Board on Geographic Names, a Federal inter-agency body chartered by public law to maintain uniform feature name usage throughout the Government and to promulgate standard names to the public. The GNIS is the official repository of domestic geographic names data; the official vehicle for geographic names use by all departments of the Federal Government; and the source for applying geographic names to Federal electronic and printed products of all types.
Tags: Anderson,
Andrews,
Angelina,
Antarctica,
Antarctica, All tags...
Aransas,
Archer,
Armstrong,
Atascosa,
Austin,
BGN,
Bailey,
Bandera,
Bastrop,
Baylor,
Bee,
Bell,
Bexar,
Blanco,
Board on Geographic Names,
Borden,
Borough,
Bosque,
Bowie,
Brazoria,
Brazos,
Brewster,
Briscoe,
Brooks,
Brown,
Burleson,
Burnet,
Caldwell,
Calhoun,
Callahan,
Cameron,
Camp,
Carson,
Cass,
Castro,
Census Area,
Chambers,
Cherokee,
Childress,
Clay,
Cochran,
Coke,
Coleman,
Collin,
Collingsworth,
Colorado,
Comal,
Comanche,
Commonwealth,
Concho,
Cooke,
Coryell,
Cottle,
County,
Crane,
Crockett,
Crosby,
Culberson,
Dallam,
Dallas,
Dawson,
DeWitt,
Deaf Smith,
Delta,
Denton,
Dickens,
Dimmit,
District,
Donley,
Downloadable Data,
Duval,
Eastland,
Ector,
Edwards,
El Paso,
Ellis,
Erath,
Falls,
Fannin,
Fayette,
Feature class,
Feature coordinates,
Feature county,
Feature description,
Feature designation,
Feature history,
Feature indentification,
Feature name,
Feature state,
Fisher,
Floyd,
Foard,
Fort Bend,
Franklin,
Freestone,
Frio,
GNIS,
Gaines,
Galveston,
Garza,
GeoPackage,
Geographic Names,
Geographic Names Full Model,
Geographic Names Information System,
Geographic feature,
Geographic name,
Geographical feature,
Geographical name,
Gillespie,
Glasscock,
Goliad,
Gonzales,
Gray,
Grayson,
Gregg,
Grimes,
Guadalupe,
Hale,
Hall,
Hamilton,
Hansford,
Hardeman,
Hardin,
Harris,
Harrison,
Hartley,
Haskell,
Hays,
Hemphill,
Henderson,
Hidalgo,
Hill,
Hockley,
Hood,
Hopkins,
Houston,
Howard,
Hudspeth,
Hunt,
Hutchinson,
Irion,
Jack,
Jackson,
Jasper,
Jeff Davis,
Jefferson,
Jim Hogg,
Jim Wells,
Johnson,
Jones,
Karnes,
Kaufman,
Kendall,
Kenedy,
Kent,
Kerr,
Kimble,
King,
Kinney,
Kleberg,
Knox,
La Salle,
Lamar,
Lamb,
Lampasas,
Lavaca,
Lee,
Leon,
Liberty,
Limestone,
Lipscomb,
Live Oak,
Llano,
Loving,
Lubbock,
Lynn,
Madison,
Marion,
Martin,
Mason,
Matagorda,
Maverick,
McCulloch,
McLennan,
McMullen,
Medina,
Menard,
Midland,
Milam,
Mills,
Mitchell,
Montague,
Montgomery,
Moore,
Morris,
Motley,
Municipio,
Nacogdoches,
National Geographic Names Information System (GNIS),
National Geographic Names Information System (GNIS),
Navarro,
Newton,
Nolan,
Nueces,
Ochiltree,
Official feature name,
Oldham,
Open Geospatial Consortium GeoPackage 1.2,
Orange,
Outlying Area,
Palo Pinto,
Panola,
Parish,
Parker,
Parmer,
Pecos,
Place name,
Polk,
Populated Place,
Potter,
Presidio,
Rains,
Randall,
Reagan,
Real,
Red River,
Reeves,
Refugio,
Roberts,
Robertson,
Rockwall,
Runnels,
Rusk,
Sabine,
San Augustine,
San Jacinto,
San Patricio,
San Saba,
Schleicher,
Scurry,
Shackelford,
Shelby,
Sherman,
Smith,
Somervell,
Starr,
State,
Stephens,
Sterling,
Stonewall,
Sutton,
Swisher,
TX,
Tarrant,
Taylor,
Terrell,
Territories,
Territory,
Terry,
Texas,
Throckmorton,
Titus,
Tom Green,
Topographic Map,
Travis,
Trinity,
Tyler,
U.S. Board on Geographic Names,
U.S. Geological Survey,
US,
USA,
USBGN,
USGS,
United States,
United States,
United States,
Upshur,
Upton,
Uvalde,
Val Verde,
Van Zandt,
Variant name,
Victoria,
Walker,
Waller,
Ward,
Washington,
Webb,
Wharton,
Wheeler,
Wichita,
Wilbarger,
Willacy,
Williamson,
Wilson,
Winkler,
Wise,
Wood,
Yoakum,
Young,
Zapata,
Zavala,
antarctic,
database,
economy,
environment,
feature,
gazetteer,
geographic,
geographic names,
geographical,
geography,
geospatial,
imageryBaseMapsEarthCover,
inlandWaters,
location,
map,
name,
place,
placename,
society,
structure,
topographic map,
toponymy, Fewer tags
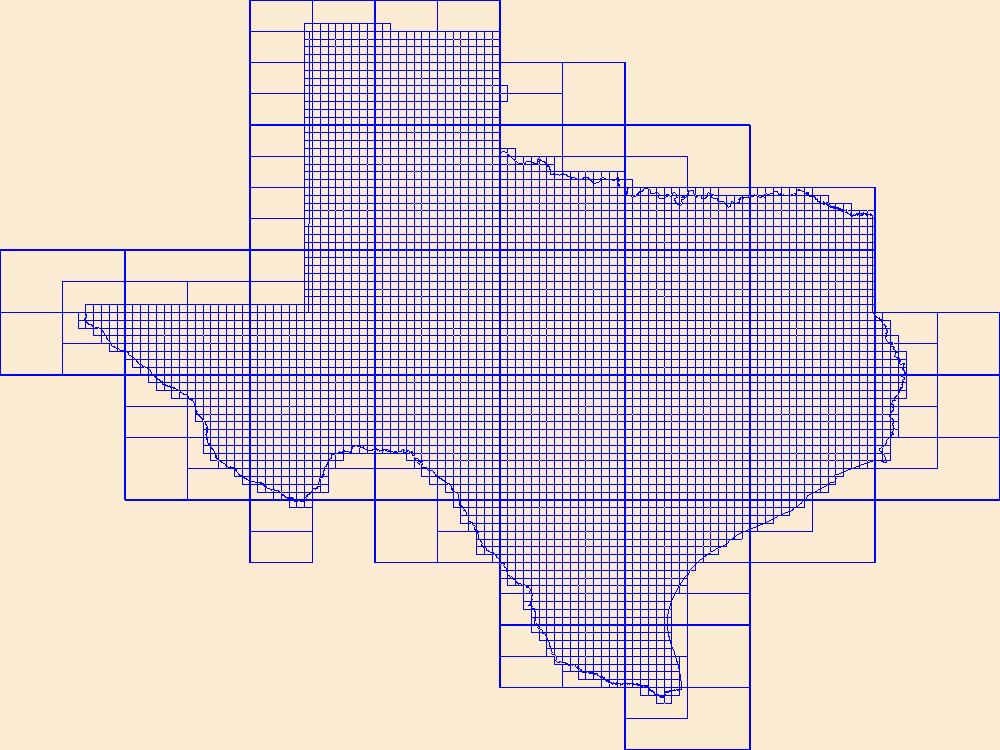
This data represents the map extent for current and historical USGS topographic maps for the United States and Territories, including 1 X 2 Degree, 1 X 1 Degree, 30 X 60 Minute, 15 X 15 Minute, 7.5 X 7.5 Minute, and 3.75 X 3.75 Minute. The grid was generated using ESRI ArcInfo GIS software.
Tags: Anderson,
Andrews,
Angelina,
Aransas,
Archer, All tags...
Armstrong,
Atascosa,
Austin,
Bailey,
Bandera,
Bastrop,
Baylor,
Bee,
Bell,
Bexar,
Blanco,
Borden,
Bosque,
Boundaries,
Bowie,
Brazoria,
Brazos,
Brewster,
Briscoe,
Brooks,
Brown,
Burleson,
Burnet,
Caldwell,
Calhoun,
Callahan,
Cameron,
Camp,
Carson,
Cass,
Castro,
Chambers,
Cherokee,
Childress,
Clay,
Cochran,
Coke,
Coleman,
Collin,
Collingsworth,
Colorado,
Comal,
Comanche,
Concho,
Cooke,
Coryell,
Cottle,
Crane,
Crockett,
Crosby,
Culberson,
Dallam,
Dallas,
Dawson,
DeWitt,
Deaf Smith,
Delta,
Denton,
Dickens,
Dimmit,
Donley,
Downloadable Data,
Duval,
Eastland,
Ector,
Edwards,
El Paso,
Ellis,
Erath,
Esri File GeoDatabase 10,
Falls,
Fannin,
Fayette,
FileGDB,
Fisher,
Floyd,
Foard,
Fort Bend,
Franklin,
Freestone,
Frio,
Gaines,
Galveston,
Garza,
Gillespie,
Glasscock,
Goliad,
Gonzales,
Gray,
Grayson,
Gregg,
Grimes,
Guadalupe,
Hale,
Hall,
Hamilton,
Hansford,
Hardeman,
Hardin,
Harris,
Harrison,
Hartley,
Haskell,
Hays,
Hemphill,
Henderson,
Hidalgo,
Hill,
Hockley,
Hood,
Hopkins,
Houston,
Howard,
Hudspeth,
Hunt,
Hutchinson,
Irion,
Jack,
Jackson,
Jasper,
Jeff Davis,
Jefferson,
Jim Hogg,
Jim Wells,
Johnson,
Jones,
Karnes,
Kaufman,
Kendall,
Kenedy,
Kent,
Kerr,
Kimble,
King,
Kinney,
Kleberg,
Knox,
La Salle,
Lamar,
Lamb,
Lampasas,
Lavaca,
Lee,
Leon,
Liberty,
Limestone,
Lipscomb,
Live Oak,
Llano,
Loving,
Lubbock,
Lynn,
Madison,
Map Indices,
Map Indices,
Map Indices,
Marion,
Martin,
Mason,
Matagorda,
Maverick,
McCulloch,
McLennan,
McMullen,
Medina,
Menard,
Midland,
Milam,
Mills,
Mitchell,
Montague,
Montgomery,
Moore,
Morris,
Motley,
Nacogdoches,
Navarro,
Newton,
Nolan,
Nueces,
Ochiltree,
Oldham,
Orange,
Palo Pinto,
Panola,
Parker,
Parmer,
Pecos,
Polk,
Potter,
Presidio,
Rains,
Randall,
Reagan,
Real,
Red River,
Reeves,
Refugio,
Roberts,
Robertson,
Rockwall,
Runnels,
Rusk,
Sabine,
San Augustine,
San Jacinto,
San Patricio,
San Saba,
Schleicher,
Scurry,
Shackelford,
Shelby,
Sherman,
Smith,
Somervell,
Starr,
State,
State,
Stephens,
Sterling,
Stonewall,
Sutton,
Swisher,
TX,
Tarrant,
Taylor,
Terrell,
Terry,
Texas,
Throckmorton,
Titus,
Tom Green,
Travis,
Trinity,
Tyler,
US,
United States,
United States of America,
Upshur,
Upton,
Uvalde,
Val Verde,
Van Zandt,
Victoria,
Walker,
Waller,
Ward,
Washington,
Webb,
Wharton,
Wheeler,
Wichita,
Wilbarger,
Willacy,
Williamson,
Wilson,
Winkler,
Wise,
Wood,
Yoakum,
Young,
Zapata,
Zavala,
cells,
map indices,
polygon grid, Fewer tags

Geospatial data includes structures and other selected map features.
Tags: Anderson,
Andrews,
Angelina,
Aransas,
Archer, All tags...
Armstrong,
Atascosa,
Austin,
Bailey,
Bandera,
Bastrop,
Baylor,
Bee,
Bell,
Bexar,
Blanco,
Borden,
Bosque,
Bowie,
Brazoria,
Brazos,
Brewster,
Briscoe,
Brooks,
Brown,
Burleson,
Burnet,
Caldwell,
Calhoun,
Callahan,
Cameron,
Camp,
Campground,
Carson,
Cass,
Castro,
Chambers,
Cherokee,
Childress,
Clay,
Cochran,
Coke,
Coleman,
College / University,
Collin,
Collingsworth,
Colorado,
Comal,
Comanche,
Concho,
Cooke,
Coryell,
Cottle,
Courthouse,
Crane,
Crockett,
Crosby,
Culberson,
Dallam,
Dallas,
Dawson,
DeWitt,
Deaf Smith,
Delta,
Denton,
Dickens,
Dimmit,
Donley,
Downloadable Data,
Duval,
Eastland,
Ector,
Edwards,
El Paso,
Ellis,
Erath,
Esri File GeoDatabase 10,
Falls,
Fannin,
Fayette,
FileGDB,
Fire Station/ EMS Station,
Fisher,
Floyd,
Foard,
Fort Bend,
Franklin,
Freestone,
Frio,
Gaines,
Galveston,
Garza,
Gillespie,
Glasscock,
Goliad,
Gonzales,
Gray,
Grayson,
Gregg,
Grimes,
Guadalupe,
Hale,
Hall,
Hamilton,
Hansford,
Hardeman,
Hardin,
Harris,
Harrison,
Hartley,
Haskell,
Hays,
Hemphill,
Henderson,
Hidalgo,
Hill,
Hockley,
Hood,
Hopkins,
Hospital/Medical Center,
Houston,
Howard,
Hudspeth,
Hunt,
Hutchinson,
Information Center,
Irion,
Jack,
Jackson,
Jasper,
Jeff Davis,
Jefferson,
Jim Hogg,
Jim Wells,
Johnson,
Jones,
Karnes,
Kaufman,
Kendall,
Kenedy,
Kent,
Kerr,
Kimble,
King,
Kinney,
Kleberg,
Knox,
La Salle,
Lamar,
Lamb,
Lampasas,
Lavaca,
Law Enforcement,
Lee,
Leon,
Liberty,
Limestone,
Lipscomb,
Live Oak,
Llano,
Loving,
Lubbock,
Lynn,
Madison,
Marion,
Martin,
Mason,
Matagorda,
Maverick,
McCulloch,
McLennan,
McMullen,
Medina,
Menard,
Midland,
Milam,
Mills,
Mitchell,
Montague,
Montgomery,
Moore,
Morris,
Motley,
Nacogdoches,
National Structures Dataset (NSD),
National Structures Dataset (NSD),
Navarro,
Newton,
Nolan,
Nueces,
Ochiltree,
Oldham,
Orange,
Palo Pinto,
Panola,
Parker,
Parmer,
Pecos,
Polk,
Post Office,
Potter,
Presidio,
Prison/ Correctional Facility,
Rains,
Randall,
Reagan,
Real,
Red River,
Reeves,
Refugio,
Roberts,
Robertson,
Rockwall,
Runnels,
Rusk,
Sabine,
San Augustine,
San Jacinto,
San Patricio,
San Saba,
Schleicher,
School,
School:Elementary,
School:High School,
School:Middle School,
Scurry,
Shackelford,
Shelby,
Sherman,
Smith,
Somervell,
Starr,
State,
State,
State Capitol,
Stephens,
Sterling,
Stonewall,
Structures,
Sutton,
Swisher,
TX,
Tarrant,
Taylor,
Technical School,
Terrell,
Terry,
Texas,
Throckmorton,
Titus,
Tom Green,
Town Hall,
Trade School,
Trailhead,
Travis,
Trinity,
Tyler,
US,
United States,
Upshur,
Upton,
Uvalde,
Val Verde,
Van Zandt,
Victoria,
Visitor Center,
Walker,
Waller,
Ward,
Washington,
Webb,
Wharton,
Wheeler,
Wichita,
Wilbarger,
Willacy,
Williamson,
Wilson,
Winkler,
Wise,
Wood,
Yoakum,
Young,
Zapata,
Zavala,
structure, Fewer tags
Geospatial data includes structures and other selected map features.
Tags: Anderson,
Andrews,
Angelina,
Aransas,
Archer, All tags...
Armstrong,
Atascosa,
Austin,
Bailey,
Bandera,
Bastrop,
Baylor,
Bee,
Bell,
Bexar,
Blanco,
Borden,
Bosque,
Bowie,
Brazoria,
Brazos,
Brewster,
Briscoe,
Brooks,
Brown,
Burleson,
Burnet,
Caldwell,
Calhoun,
Callahan,
Cameron,
Camp,
Campground,
Carson,
Cass,
Castro,
Chambers,
Cherokee,
Childress,
Clay,
Cochran,
Coke,
Coleman,
College / University,
Collin,
Collingsworth,
Colorado,
Comal,
Comanche,
Concho,
Cooke,
Coryell,
Cottle,
Courthouse,
Crane,
Crockett,
Crosby,
Culberson,
Dallam,
Dallas,
Dawson,
DeWitt,
Deaf Smith,
Delta,
Denton,
Dickens,
Dimmit,
Donley,
Downloadable Data,
Duval,
Eastland,
Ector,
Edwards,
El Paso,
Ellis,
Erath,
Falls,
Fannin,
Fayette,
Fire Station/ EMS Station,
Fisher,
Floyd,
Foard,
Fort Bend,
Franklin,
Freestone,
Frio,
Gaines,
Galveston,
Garza,
GeoPackage,
Gillespie,
Glasscock,
Goliad,
Gonzales,
Gray,
Grayson,
Gregg,
Grimes,
Guadalupe,
Hale,
Hall,
Hamilton,
Hansford,
Hardeman,
Hardin,
Harris,
Harrison,
Hartley,
Haskell,
Hays,
Hemphill,
Henderson,
Hidalgo,
Hill,
Hockley,
Hood,
Hopkins,
Hospital/Medical Center,
Houston,
Howard,
Hudspeth,
Hunt,
Hutchinson,
Information Center,
Irion,
Jack,
Jackson,
Jasper,
Jeff Davis,
Jefferson,
Jim Hogg,
Jim Wells,
Johnson,
Jones,
Karnes,
Kaufman,
Kendall,
Kenedy,
Kent,
Kerr,
Kimble,
King,
Kinney,
Kleberg,
Knox,
La Salle,
Lamar,
Lamb,
Lampasas,
Lavaca,
Law Enforcement,
Lee,
Leon,
Liberty,
Limestone,
Lipscomb,
Live Oak,
Llano,
Loving,
Lubbock,
Lynn,
Madison,
Marion,
Martin,
Mason,
Matagorda,
Maverick,
McCulloch,
McLennan,
McMullen,
Medina,
Menard,
Midland,
Milam,
Mills,
Mitchell,
Montague,
Montgomery,
Moore,
Morris,
Motley,
Nacogdoches,
National Structures Dataset (NSD),
National Structures Dataset (NSD),
Navarro,
Newton,
Nolan,
Nueces,
Ochiltree,
Oldham,
Open Geospatial Consortium GeoPackage 1.2,
Orange,
Palo Pinto,
Panola,
Parker,
Parmer,
Pecos,
Polk,
Post Office,
Potter,
Presidio,
Prison/ Correctional Facility,
Rains,
Randall,
Reagan,
Real,
Red River,
Reeves,
Refugio,
Roberts,
Robertson,
Rockwall,
Runnels,
Rusk,
Sabine,
San Augustine,
San Jacinto,
San Patricio,
San Saba,
Schleicher,
School,
School:Elementary,
School:High School,
School:Middle School,
Scurry,
Shackelford,
Shelby,
Sherman,
Smith,
Somervell,
Starr,
State,
State,
State Capitol,
Stephens,
Sterling,
Stonewall,
Structures,
Sutton,
Swisher,
TX,
Tarrant,
Taylor,
Technical School,
Terrell,
Terry,
Texas,
Throckmorton,
Titus,
Tom Green,
Town Hall,
Trade School,
Trailhead,
Travis,
Trinity,
Tyler,
US,
United States,
Upshur,
Upton,
Uvalde,
Val Verde,
Van Zandt,
Victoria,
Visitor Center,
Walker,
Waller,
Ward,
Washington,
Webb,
Wharton,
Wheeler,
Wichita,
Wilbarger,
Willacy,
Williamson,
Wilson,
Winkler,
Wise,
Wood,
Yoakum,
Young,
Zapata,
Zavala,
structure, Fewer tags
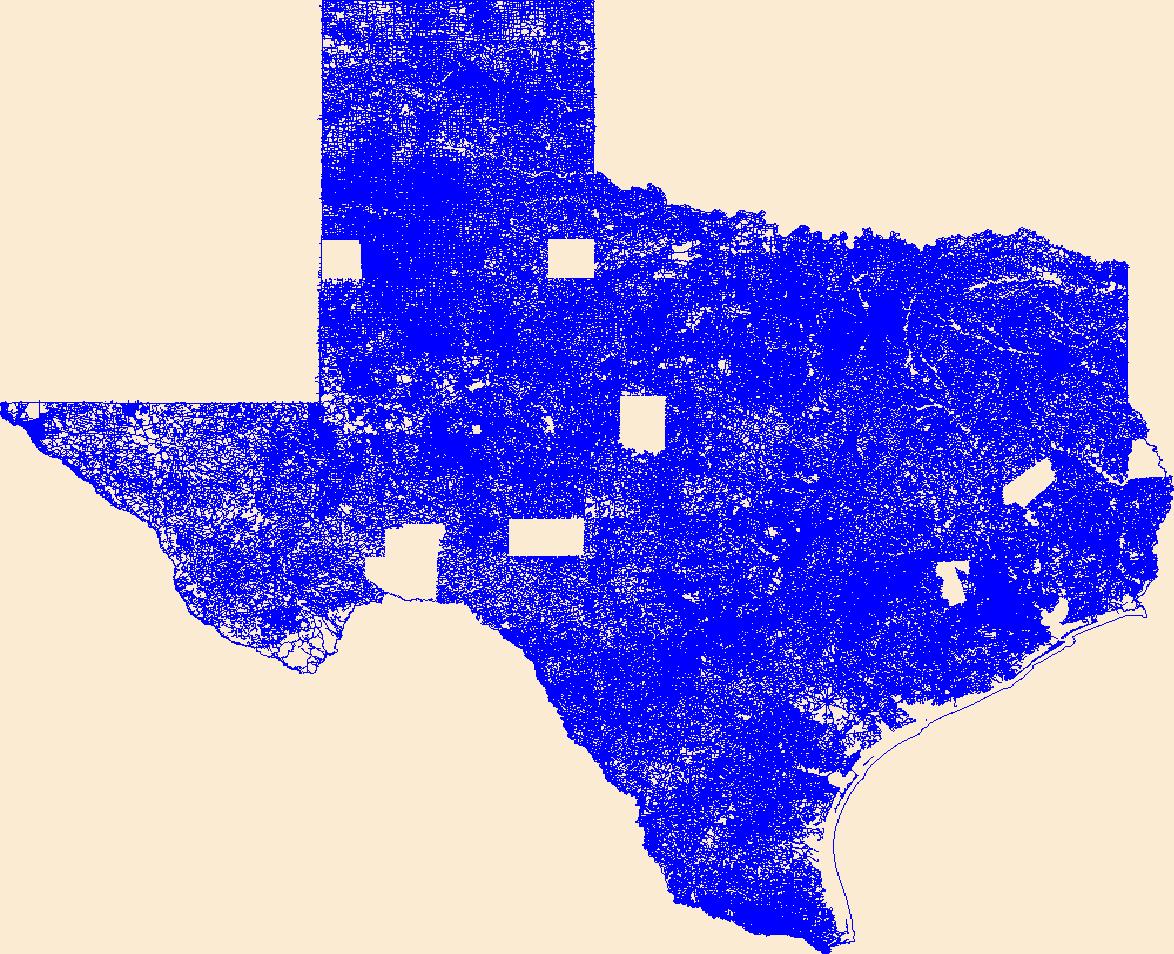
Layers of geospatial data include roads, airports, trails, and railroads.
Tags: Airport Complex,
Airport Point,
Airport Runway,
Airports,
Airstrips, All tags...
Anderson,
Andrews,
Angelina,
Aransas,
Archer,
Armstrong,
Atascosa,
Austin,
Bailey,
Bandera,
Bastrop,
Baylor,
Bee,
Bell,
Bexar,
Blanco,
Borden,
Bosque,
Bowie,
Brazoria,
Brazos,
Brewster,
Briscoe,
Brooks,
Brown,
Burleson,
Burnet,
Caldwell,
Calhoun,
Callahan,
Cameron,
Camp,
Carson,
Cass,
Castro,
Chambers,
Cherokee,
Childress,
Clay,
Cochran,
Coke,
Coleman,
Collin,
Collingsworth,
Colorado,
Comal,
Comanche,
Concho,
Cooke,
Coryell,
Cottle,
Crane,
Crockett,
Crosby,
Culberson,
Dallam,
Dallas,
Dawson,
DeWitt,
Deaf Smith,
Delta,
Denton,
Dickens,
Dimmit,
Donley,
Downloadable Data,
Duval,
Eastland,
Ector,
Edwards,
El Paso,
Ellis,
Erath,
Esri File GeoDatabase 10,
Falls,
Fannin,
Fayette,
FileGDB,
Fisher,
Floyd,
Foard,
Fort Bend,
Franklin,
Freestone,
Frio,
Gaines,
Galveston,
Garza,
Geographic names,
Gillespie,
Glasscock,
Goliad,
Gonzales,
Gray,
Grayson,
Gregg,
Grimes,
Guadalupe,
Hale,
Hall,
Hamilton,
Hansford,
Hardeman,
Hardin,
Harris,
Harrison,
Hartley,
Haskell,
Hays,
Hemphill,
Henderson,
Hidalgo,
Hill,
Hockley,
Hood,
Hopkins,
Houston,
Howard,
Hudspeth,
Hunt,
Hutchinson,
Irion,
Jack,
Jackson,
Jasper,
Jeff Davis,
Jefferson,
Jim Hogg,
Jim Wells,
Johnson,
Jones,
Karnes,
Kaufman,
Kendall,
Kenedy,
Kent,
Kerr,
Kimble,
King,
Kinney,
Kleberg,
Knox,
La Salle,
Lamar,
Lamb,
Lampasas,
Lavaca,
Lee,
Leon,
Liberty,
Limestone,
Lipscomb,
Live Oak,
Llano,
Loving,
Lubbock,
Lynn,
Madison,
Marion,
Martin,
Mason,
Matagorda,
Maverick,
McCulloch,
McLennan,
McMullen,
Medina,
Menard,
Midland,
Milam,
Mills,
Mitchell,
Montague,
Montgomery,
Moore,
Morris,
Motley,
Nacogdoches,
National Transportation Dataset (NTD),
National Transportation Dataset (NTD),
Navarro,
Newton,
Nolan,
Nueces,
Ochiltree,
Oldham,
Orange,
Palo Pinto,
Panola,
Parker,
Parmer,
Pecos,
Polk,
Potter,
Presidio,
Railways,
Rains,
Randall,
Reagan,
Real,
Red River,
Reeves,
Refugio,
Roads,
Roberts,
Robertson,
Rockwall,
Runnels,
Rusk,
Sabine,
San Augustine,
San Jacinto,
San Patricio,
San Saba,
Schleicher,
Scurry,
Shackelford,
Shelby,
Sherman,
Smith,
Somervell,
Starr,
State,
State,
Stephens,
Sterling,
Stonewall,
Sutton,
Swisher,
TX,
Tarrant,
Taylor,
Terrell,
Terry,
Texas,
Throckmorton,
Titus,
Tom Green,
Trail,
Trails,
Transportation,
Transportation,
Travis,
Trinity,
Tyler,
US,
United States,
Upshur,
Upton,
Uvalde,
Val Verde,
Van Zandt,
Victoria,
Walker,
Waller,
Ward,
Washington,
Waterway,
Webb,
Wharton,
Wheeler,
Wichita,
Wilbarger,
Willacy,
Williamson,
Wilson,
Winkler,
Wise,
Wood,
Yoakum,
Young,
Zapata,
Zavala,
transportation, Fewer tags

Predicted probability of fisher summer occurrence created with Maxent (Phillips et al. 2006) using fisher detections (N = 83, May – November, spanning 1993 – 2009) and eight predictor variables: mean annual precipitation, mean summer (July – September) precipitation, mean summer temperature amplitude, mean understory index (fraction of grass vegetation carbon in forest), mean fraction of total forest carbon in coarse wood carbon, mean forest carbon (g C m2), mean fraction of vegetation carbon in forest, and modal vegetation class. Predictor variables had a grid cell size of 4 km by 4 km, vegetation variables were simulated by the MC1 dynamic global vegetation model (Bachelet et al. 2001) and historical climate variables...
Tags: california,
climate,
fisher,
mammal,
mc1, All tags...
north america,
species distribution model,
usa,
wildlife habitat,
yale, Fewer tags

Predicted probability of fisher year-round occurrence created with Maxent (Phillips et al. 2006) using fisher detections (N = 102, spanning 1993 – 2011) and nine predictor variables: mean winter (January – March) precipitation, mean summer (July – September) precipitation, mean summer temperature amplitude, mean daily low temperature for the month of the year with the warmest mean daily low temperature, average number of months with mean temperature < 0°C, mean understory index (fraction of grass vegetation carbon in forest), mean fraction of total forest carbon in coarse wood carbon, mean forest carbon (g C m2), mean fraction of vegetation carbon in forest, and modal vegetation class. Predictor variables had a...
Tags: california,
climate,
fisher,
mammal,
mc1, All tags...
north america,
species distribution model,
usa,
wildlife habitat,
yale, Fewer tags
|
|

