Filters: Tags: forest (X) > partyWithName: Conservation Biology Institute (X)
142 results (17ms)|
Filters
Date Range
Extensions Contacts
Categories Tag Types
|
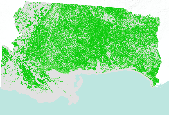
This dataset portrays percent tree canopy coverage for NLCD mapping superzone twelve (south), covering parts of Louisiana, Mississippi, Alabama, Florida, and Arkansas . Refer to http://www.mrlc.gov/nlcd_multizone_map.php for a map of the superzones. From NLCD: The National Land Cover Database 2001 was produced through a cooperative project conducted by the Multi-Resolution Land Characteristics (MRLC) Consortium. The MRLC Consortium is a partnership of federal agencies (www.mrlc.gov), consisting of the U.S. Geological Survey (USGS), the National Oceanic and Atmospheric Administration (NOAA), the U.S. Environmental Protection Agency (EPA), the U.S. Department of Agriculture (USDA), the U.S. Forest Service (USFS),...

This dataset represents presence of Jack Pine (Pinus banksiana) in Minnesota (USA) at year 50 (2045) from a single model run of LANDIS-II. The simulation assumed Intergovernmental Panel on Climate Change (IPCC) B2 emissions (moderate) and used the Hadley 3 global circulation model. Restoration harvest rates and intensities were simulated.

This dataset represents presence of Sugar Maple (Acer saccharum) in Minnesota (USA) at year 0 (2145) from a single model run of LANDIS-II. The simulation assumed Intergovernmental Panel on Climate Change (IPCC) B2 emissions (moderate) and used the Hadley 3 global circulation model. Contemporary harvest rates and intensities were simulated.

This map depicts the forested regions in the western United States. Data was obtained from the the Sagestitch map and other state-level GAP landcover maps and merged into 90m raster dataset.

A nationally compiled dataset containing provincial Forest Tenures/Forest Management Areas and other administrative areas where rights to establish, grow, harvest or remove timber from a particular area of land has been granted. Each province has different boundary definitions and/or harvesting practices which prevents this dataset from having a standard defined tenure unit for all of Canada (See data sources in metadata). British Columbia was the only province where tenure boundaries had to be complied from several different sources in order to have a definable tenure unit comparable to other provinces (see NOTES in metadata).

This dataset displays the boundaries of Intact Forest Landscapes for the Kenai region of the state of Alaska. Intact Forest Landscapes are defined as areas at least 50,000 hectares that are absent of human disturbance visible on satellite imagery (e.g., roads, logging, mining, settlement). For more information, see the full report, available on the Global Forest Watch website (www.globalforestwatch.org), or the Conservation Biology Institute website (http://www.consbio.org/cbi/projects/show.php?page=alaska);.

A nationally compiled dataset containing provincial Forest Tenures/Forest Management Areas and other administrative areas where rights to establish, grow, harvest or remove timber from a particular area of land has been granted. Each province has different boundary definitions and/or harvesting practices which prevents this dataset from having a standard defined tenure unit for all of Canada (See data sources in metadata). British Columbia was the only province where tenure boundaries had to be complied from several different sources in order to have a definable tenure unit comparable to other provinces (see NOTES in metadata).

Forest cover types (deciduous forest (41), evergreen forest (42), mixed forest (43), shrub/scrub (52), woody wetland (90)) were isolated from the 2001 National Land Cover Dataset (1 = forest, 0 = non-forest). To improve processing time of running a large focal mean across an expansive region, the “aggregate” tool was applied to the forest grid and re-sampled the 30 m pixels to 90 m using the mean aggregate option (i.e., the result is new 90 m pixels representing the proportion of forest in 9 pixels). A 10 km circular focal mean was applied to the aggregated grid resulting in a new floating point raster containing the proportion of forest within 10 km of each 90 m pixel. These values were multiplied by 100, rounded...

This dataset represents presence of white pine (Pinus strobus) at year 100 (2095) from a single model run of LANDIS-II. The simulation assumed Intergovernmental Panel on Climate Change (IPCC) B2 emissions (moderate) and used the Hadley 3 global circulation model. Contemporary harvest rates and intensities were simulated.

This dataset portrays percent tree canopy coverage for NLCD mapping superzone two, covering most of California and Nevada, and very small portions of Utah and Arizona. Refer to http://www.mrlc.gov/nlcd_multizone_map.php for a map of the super-zones. From NLCD: The National Land Cover Database 2001 was produced through a cooperative project conducted by the Multi-Resolution Land Characteristics (MRLC) Consortium. The MRLC Consortium is a partnership of federal agencies (www.mrlc.gov), consisting of the U.S. Geological Survey (USGS), the National Oceanic and Atmospheric Administration (NOAA), the U.S. Environmental Protection Agency (EPA), the U.S. Department of Agriculture (USDA), the U.S. Forest Service (USFS),...
Tags: forest,
tree canopy

The NHESP Natural Communities datalayer consists of polygons that represent the extent of various natural communities of biodiversity conservation interest in Massachusetts. These polygons are based on records of natural communities maintained in the Natural Heritage & Endangered Species Program (NHESP) database. Program scientists classify and delineate natural community polygons by analyzing "on-the-ground" field data and available information about the landscape (particularly topographic maps and aerial photographs). All sites in the NHESP database have been visited by NHESP biologists or by other biologists who have submitted reports on community occurrences that NHESP biologists have reviewed and accepted....

This map layer is extracted from a grid map of North America including the Caribbean and most of Mexico. The map layer is an excerpt from a global assessment of forest fragmentation (Riitters et al., 2000). Each pixel value represents an index of forest fragmentation for the surrounding 81 sq. km. The map layer was created by applying spatial algorithms to a 1 sq. km. resolution map of global land cover (Loveland and Belward 1997) known as NAIGBP1_2L, obtained from the USGS Center for EROS Distributed Active Archive Center (DAAC) as part of the Global Land Cover Characteristics database (GLCC)(Loveland et al. 1991, 1999). One of six categories of fragmentation was identified for each forested pixel in North...

This dataset represents presence of Black Spruce (Picea mariana) at year 100 (2095) from a single model run of LANDIS-II. The simulation assumed Intergovernmental Panel on Climate Change (IPCC) B2 emissions (moderate) and used the Hadley 3 global circulation model. Contemporary harvest rates and intensities were simulated.

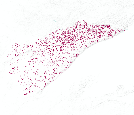
This data represents areas of forest damage due to insect infestation, fire, flood, landslides, windthrow and other mortalities. The information was collected by aerial surveys by both the USFS and ADNR, Div. of Forestry in cooperation with the Forest Health Protection (FHP) project. Surveys are conducted in July and August so that pest "signatures" may be obtained during the optimal period for symptom development of ocular estimation. The aerial survey is coordinated with known pest outbreaks so that the maximum extent of recent bark beetle damage (fading trees) and insect defoliation (discoloration, foliage loss) patterns may be determined. Aerial survey flights are termed as "local" if they can be completed...

This data represents areas of forest damage due to insect infestation, fire, flood, landslides, windthrow and other mortalities. The information was collected by aerial surveys by both the USFS and ADNR, Div. of Forestry in cooperation with the Forest Health Protection (FHP) project. Surveys are conducted in July and August so that pest "signatures" may be obtained during the optimal period for symptom development of ocular estimation. The aerial survey is coordinated with known pest outbreaks so that the maximum extent of recent bark beetle damage (fading trees) and insect defoliation (discoloration, foliage loss) patterns may be determined. Aerial survey flights are termed as "local" if they can be completed...
This dataset represents presence of Red Pine (Pinus resinosa) at year 50 (2045) in Minnesota (USA) from a single model run of LANDIS-II. The simulation assumed Intergovernmental Panel on Climate Change (IPCC) B2 emissions (moderate) and used the Hadley 3 global circulation model. Contemporary harvest rates and intensities were simulated.

This dataset represents presence of Red Pine (Pinus resinosa) at year 0 (1995) in Minnesota (USA) from a single model run of LANDIS-II. The simulation assumed Intergovernmental Panel on Climate Change (IPCC) B2 emissions (moderate) and used the Hadley 3 global circulation model. Restoration harvest rates and intensities were simulated.

This dataset represents presence of Black Spruce (Picea mariana) at year 150 (2145) from a single model run of LANDIS-II. The simulation assumed Intergovernmental Panel on Climate Change (IPCC) B2 emissions (moderate) and used the Hadley 3 global circulation model. Restoration harvest rates and intensities were simulated.

This dataset represents presence of Sugar Maple (Acer saccharum) at year 100 (2095) from a single model run of LANDIS-II. The simulation assumed Intergovernmental Panel on Climate Change (IPCC) B2 emissions (moderate) and used the Hadley 3 global circulation model. Restoration harvest rates and intensities were simulated.

This dataset provides a watershed index of surface drinking water importance, a watershed index of forest importance to surface drinking water, and a watershed index to highlight the extent to which development, fire, and insects and disease threaten forests important for surface drinking water. This tabular dataset is meant to be joined with the NRCS Watershed Boundary Dataset HUC-12. The results of this assessment provides information that can identify areas of interest for protecting surface drinking water quality. The spatial dataset can be incorporated into broad-scale planning, such as the State Forest Action Plans, and can be incorporated into existing decision support tools that currently lack spatial data...
|

|
