Filters: Tags: forest (X)
1,020 results (38ms)|
Filters
Date Range
Extensions Types Contacts
Categories Tag Types
|
The National Hydrography Dataset (NHD) is a feature-based database that interconnects and uniquely identifies the stream segments or reaches that make up the nation's surface water drainage system. NHD data was originally developed at 1:100,000-scale and exists at that scale for the whole country. This high-resolution NHD, generally developed at 1:24,000/1:12,000 scale, adds detail to the original 1:100,000-scale NHD. (Data for Alaska, Puerto Rico and the Virgin Islands was developed at high-resolution, not 1:100,000 scale.) Local resolution NHD is being developed where partners and data exist. The NHD contains reach codes for networked features, flow direction, names, and centerline representations for areal water...
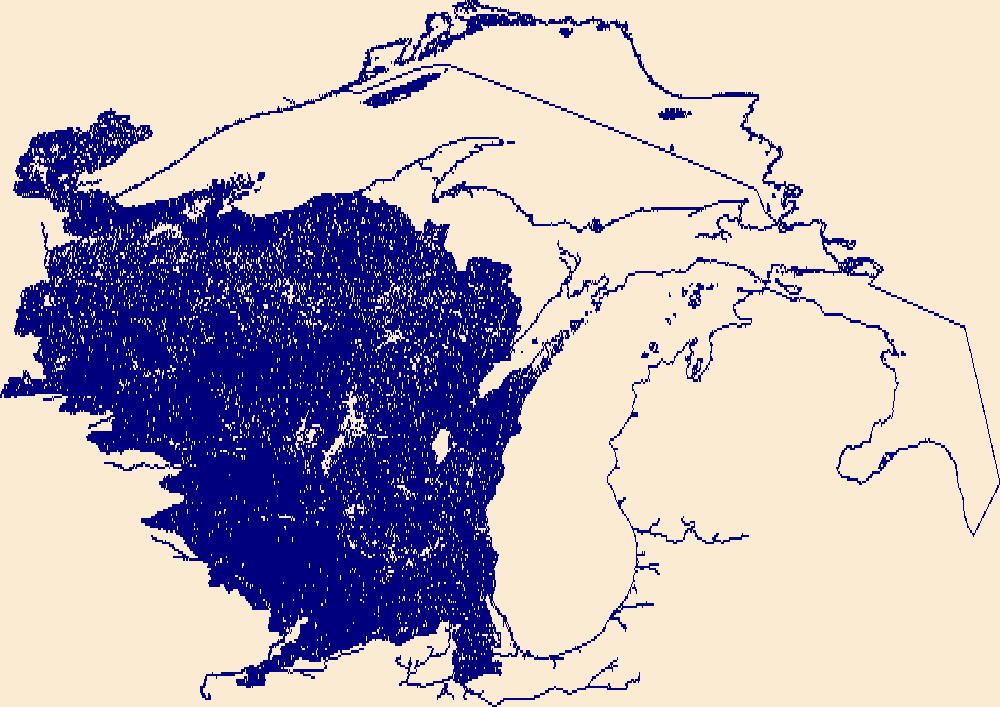
In the late 1880's and early 1900's the Mississippi River Commission (MRC) conducted an extensive high-resolution survey of the Mississippi River from Cairo, Illinois to Minneapolis, Minnesota. These data were published as a series of 89 survey maps and index. In the 1990's, the Upper Midwest Environmental Sciences Center (UMESC) in conjunction with the US Army Corps of Engineers Upper Mississippi River Restoration- Environmental Management Program -- Long Term Resource Monitoring Program element (LTRMP) for the Upper Mississippi River automated the maps' land cover/use symbology to create a turn of the century/pre-impoundment land cover/use data set. Other data on the maps that were not automated include; elevation...
In the late 1880's and early 1900's the Mississippi River Commission (MRC) conducted an extensive high-resolution survey of the Mississippi River from Cairo, Illinois to Minneapolis, Minnesota. These data were published as a series of 89 survey maps and index. In the 1990's, the Upper Midwest Environmental Sciences Center (UMESC) in conjunction with the US Army Corps of Engineers Upper Mississippi River Restoration- Environmental Management Program -- Long Term Resource Monitoring Program element (LTRMP) for the Upper Mississippi River automated the maps' land cover/use symbology to create a turn of the century/pre-impoundment land cover/use data set. Other data on the maps that were not automated include; elevation...
Categories: Data;
Types: Map Service,
OGC WFS Layer,
OGC WMS Layer,
OGC WMS Service,
Shapefile;
Tags: Forest,
Illinois,
Land Cover,
Land Use,
Marsh,
In the late 1880's and early 1900's the Mississippi River Commission (MRC) conducted an extensive high-resolution survey of the Mississippi River from Cairo, Illinois to Minneapolis, Minnesota. These data were published as a series of 89 survey maps and index. In the 1990's, the Upper Midwest Environmental Sciences Center (UMESC) in conjunction with the US Army Corps of Engineers Upper Mississippi River Restoration- Environmental Management Program -- Long Term Resource Monitoring Program element (LTRMP) for the Upper Mississippi River automated the maps' land cover/use symbology to create a turn of the century/pre-impoundment land cover/use data set. Other data on the maps that were not automated include; elevation...
In the late 1880's and early 1900's the Mississippi River Commission (MRC) conducted an extensive high-resolution survey of the Mississippi River from Cairo, Illinois to Minneapolis, Minnesota. These data were published as a series of 89 survey maps and index. In the 1990's, the Upper Midwest Environmental Sciences Center (UMESC) in conjunction with the US Army Corps of Engineers Upper Mississippi River Restoration- Environmental Management Program -- Long Term Resource Monitoring Program element (LTRMP) for the Upper Mississippi River automated the maps' land cover/use symbology to create a turn of the century/pre-impoundment land cover/use data set. Other data on the maps that were not automated include; elevation...
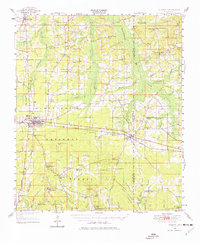
USGS Historical Quadrangle in GeoPDF.
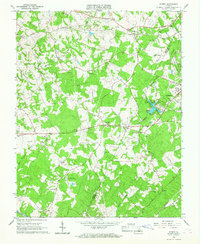
USGS Historical Quadrangle in GeoPDF.
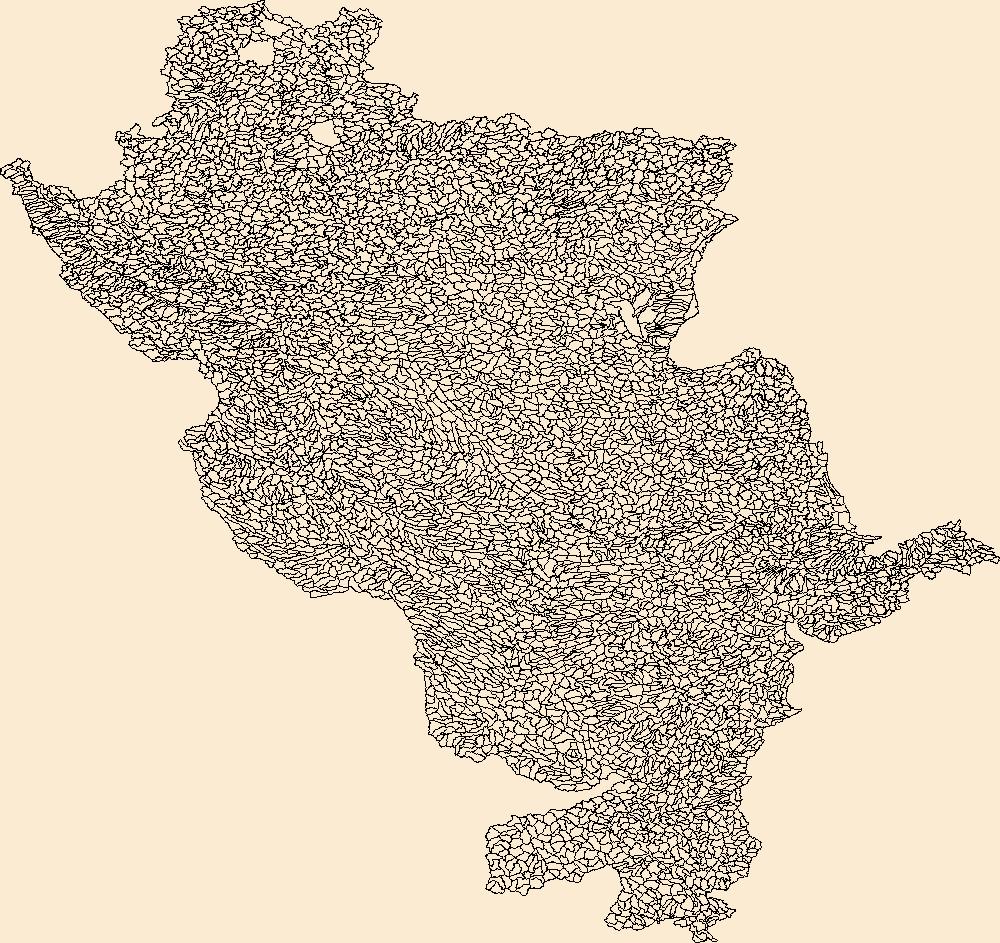
The Watershed Boundary Dataset (WBD) is a comprehensive aggregated collection of hydrologic unit data consistent with the national criteria for delineation and resolution. It defines the areal extent of surface water drainage to a point except in coastal or lake front areas where there could be multiple outlets as stated by the "Federal Standards and Procedures for the National Watershed Boundary Dataset (WBD)" "Standard" (https://pubs.usgs.gov/tm/11/a3/). Watershed boundaries are determined solely upon science-based hydrologic principles, not favoring any administrative boundaries or special projects, nor particular program or agency. This dataset represents the hydrologic unit boundaries to the 12-digit (6th level)...
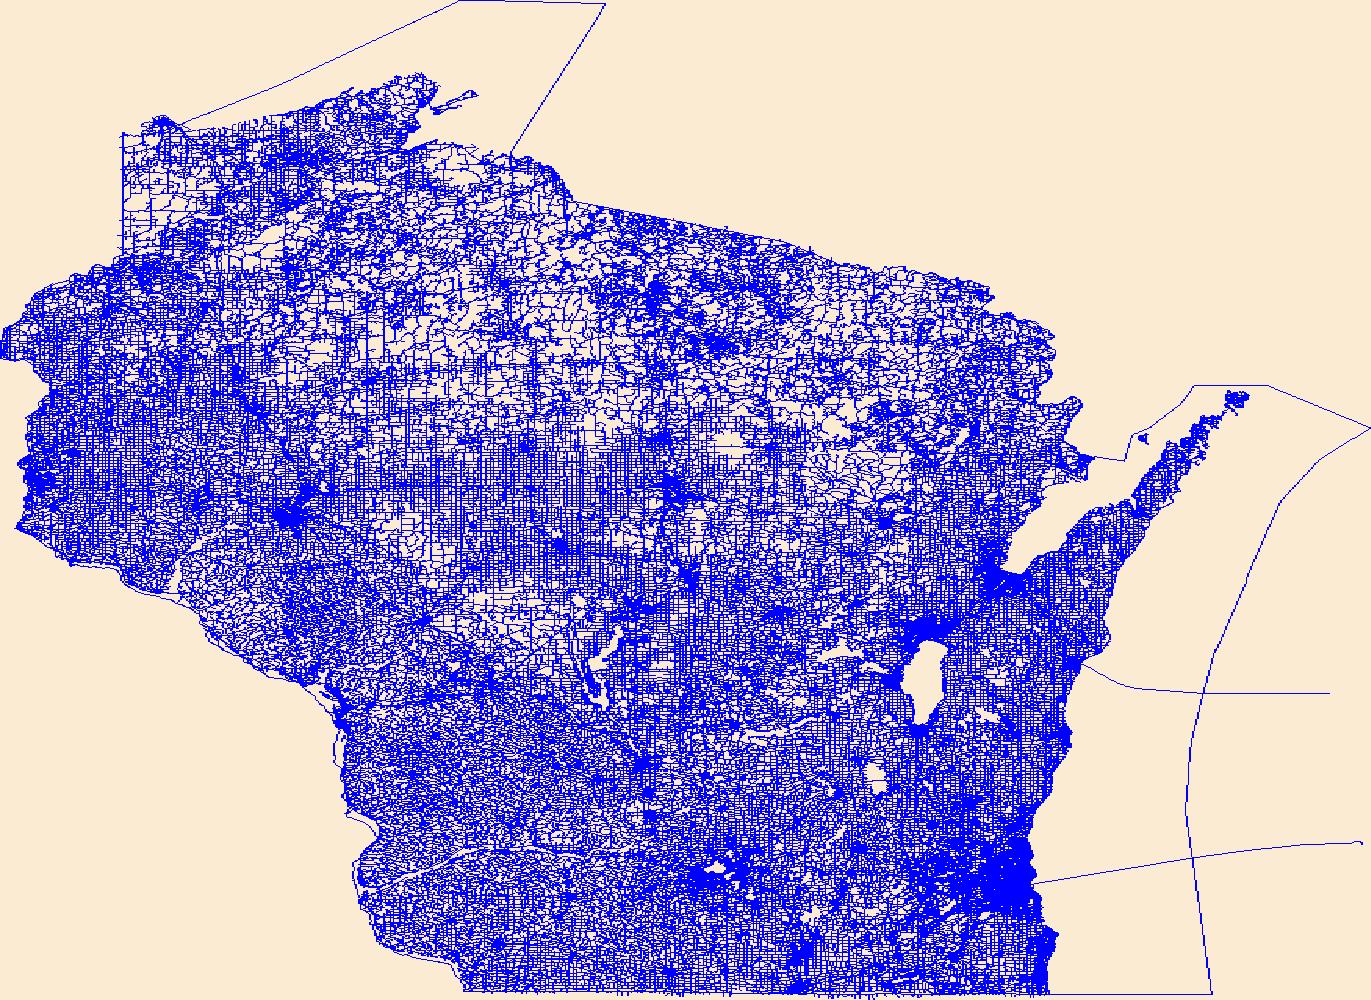
Layers of geospatial data include roads, airports, trails, and railroads.
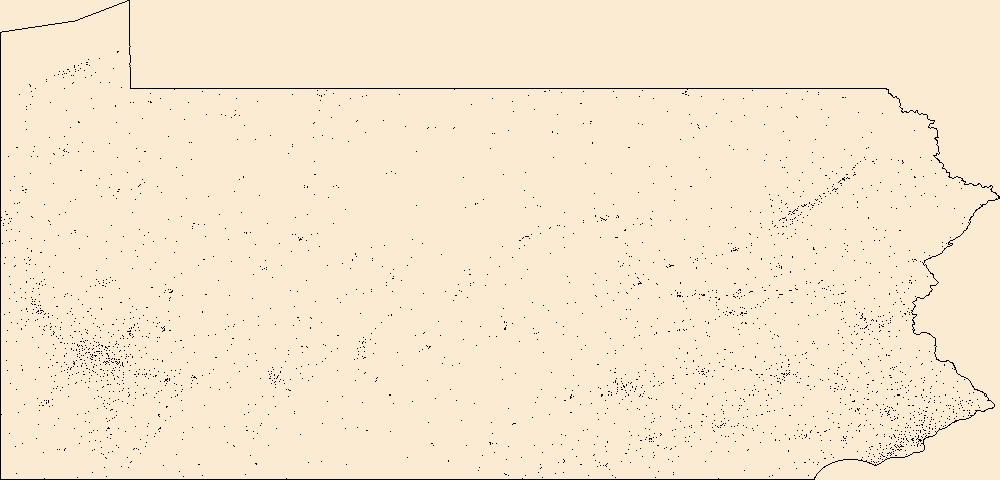
Geospatial data includes structures and other selected map features.
Data accompanying the manuscript 'Patterns and drivers of early conifer regeneration following stand-replacing wildfire in Pacific Northwest (USA) temperate maritime forests' by Laughlin, Rangel-Parra, Morris, Donato, Halofsky and Harvey published in Forest Ecology and Management. Data include field measurements of post-fire seedling abundance and additional information about the forest stands where data were collected. See the main text of the manuscript for complete descriptions of how data were collected, and greater specifics on values and classifications.
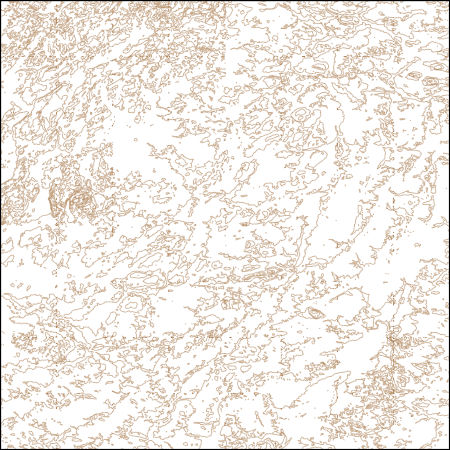
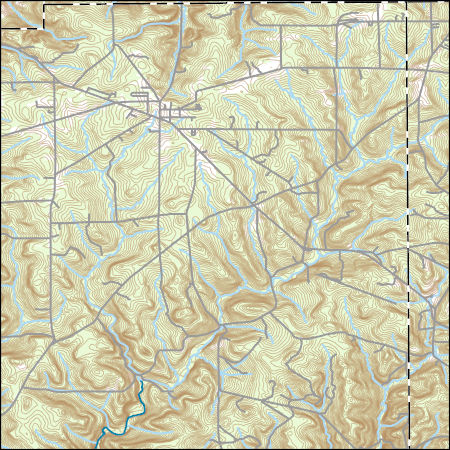
These vector contour lines are derived from the 3D Elevation Program using automated and semi-automated processes. They were created to support 1:24,000-scale CONUS and Hawaii, 1:25,000-scale Alaska, and 1:20,000-scale Puerto Rico / US Virgin Island topographic map products, but are also published in this GIS vector format. Contour intervals are assigned by 7.5-minute quadrangle, so this vector dataset is not visually seamless across quadrangle boundaries. The vector lines have elevation attributes (in feet above mean sea level on NAVD88), but this dataset does not carry line symbols or annotation.
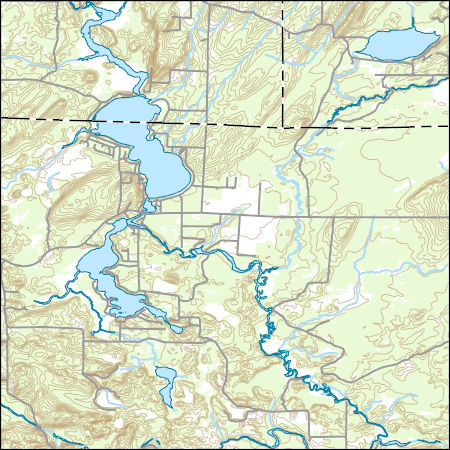
Layers of geospatial data include contours, boundaries, land cover, hydrography, roads, transportation, geographic names, structures, and other selected map features.
Types: Citation;
Tags: 7.5 x 7.5 minute,
7_5_Min,
Combined Vector,
Combined Vector,
Combined Vector,
The Potential Reforestation Index geospatial data product is a companion to the Forest Retention Index product from the Mapping the South’s Forests of the Future project. The Retention Index describes the likelihood that existing forests will remain in a forested condition at decadal time steps through 2060. The Potential Reforestation Index describes the likelihood that a non-forested land unit will be converted to forest cover at those same time steps. We used two datasets to determine areas currently occupied by agriculture that may be most conducive to reforestation efforts: National Commodity Crop Productivity Index (NCCPI) and Potentially Restorable Wetlands on Agriculture Land (PRWAg). The NCCPI is available...
Categories: Data;
Types: ArcGIS REST Map Service,
ArcGIS Service Definition,
Downloadable,
Map Service;
Tags: Alabama,
Alabama (AL),
Arkansas,
Arkansas (AR),
Conservation,
Forest Retention Index classes for the southeastern United States at 2040 were processed using the Forest Retention Decision Tree and rendered on a 30-meter by 30-meter grid. The Forest Retention Index is used only for current forestland, identified using National Land Cover Database 2011. Many datasets were used as inputs for the Forest Retention Decision Tree, and they can be grouped into five broad categories: Protected, Tier 1 Priority, Tier 2 Priority, Threats to Forest Retention, and Socio-Economic Value of Forests. Protected datasets include Protected Areas Database-United States, National Conservation Easement Database, state-maintained databases, and private datasets volunteered by conservation partners....
Categories: Data;
Types: ArcGIS REST Map Service,
ArcGIS Service Definition,
Downloadable,
Map Service;
Tags: Alabama,
Arkansas,
Florida,
Georgia,
Illinois,
Conclusions: The proportion of wetlands in the watershed at different scales affects dissolved organic carbon (DOC) concentrations in downstream lakes and rivers. Thresholds/Learnings: Synopsis: This study quantifies how the proportion of wetlands in the watershed at different scales affects dissolved organic carbon (DOC) concentrations in downstream lakes and rivers. Whether the watershed influence varies with season or hydrologic type of lake was also examined. The scaling and modelling approach used offered a useful way to examine heterogeneity of land cover types within the watershed and spatial arrangements, while allowing generality of conclusions with a large sample size. Zones of increasing distance from...
Categories: Publication;
Types: Citation,
Map Service,
OGC WFS Layer,
OGC WMS Layer,
OGC WMS Service;
Tags: Agriculture,
DOC,
Dissolved Organic Carbon,
Forest,
Human Impacts,
Conclusions:The paper describes the development and use of the Forest Water Quality Index (FWQI), an index to capture, evaluate and communicate the impact of forestry activities on water quality. The index is used to predict the water quality in watersheds anticipating future forestry activities by comparing data from similar watersheds that have already experienced forestry activities.Thresholds/Learnings:
Categories: Publication;
Types: Citation;
Tags: Land use configuration,
Natural cover amount,
Newfoundland,
forest,
forestry,
Layers of geospatial data include contours, boundaries, land cover, hydrography, roads, transportation, geographic names, structures, and other selected map features.
Types: Citation;
Tags: 7.5 x 7.5 minute,
7_5_Min,
Combined Vector,
Combined Vector,
Combined Vector,
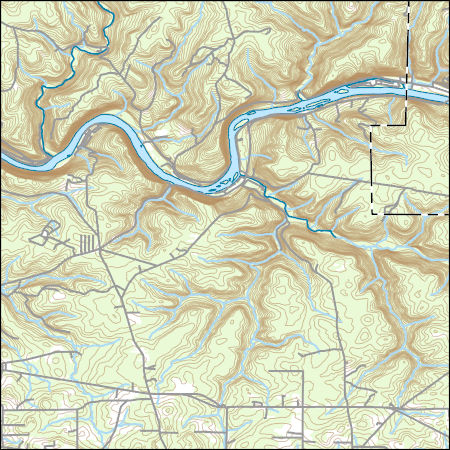
Layers of geospatial data include contours, boundaries, land cover, hydrography, roads, transportation, geographic names, structures, and other selected map features.
Types: Citation;
Tags: 7.5 x 7.5 minute,
7_5_Min,
Combined Vector,
Combined Vector,
Combined Vector,
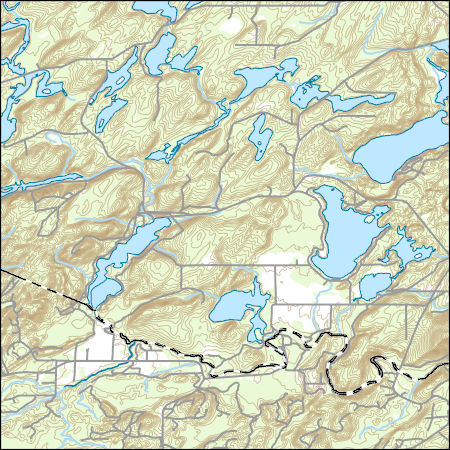
Layers of geospatial data include contours, boundaries, land cover, hydrography, roads, transportation, geographic names, structures, and other selected map features.
Types: Citation;
Tags: 7.5 x 7.5 minute,
7_5_Min,
Combined Vector,
Combined Vector,
Combined Vector,
|

|
