Filters: Tags: geospatial analysis (X)
808 results (58ms)|
Filters
Date Range
Extensions Types Contacts
Categories
Tag Types
|
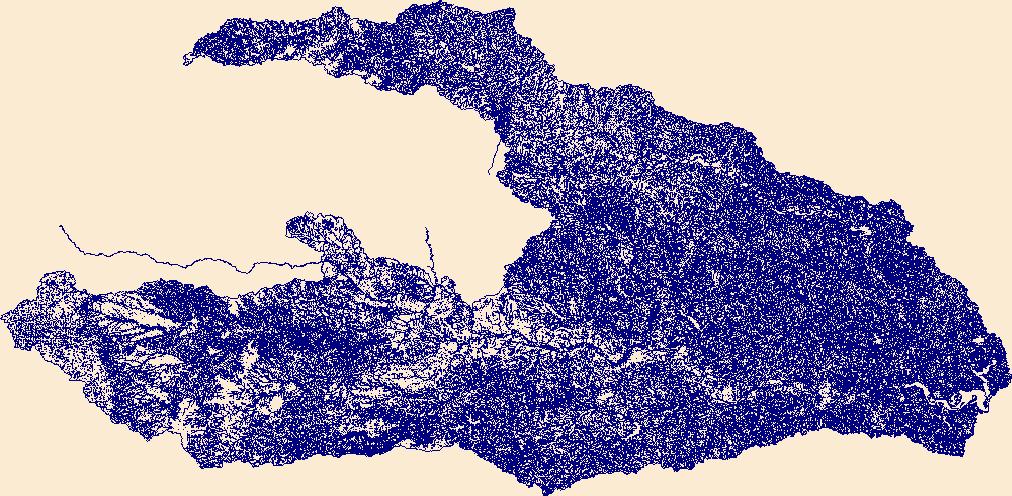
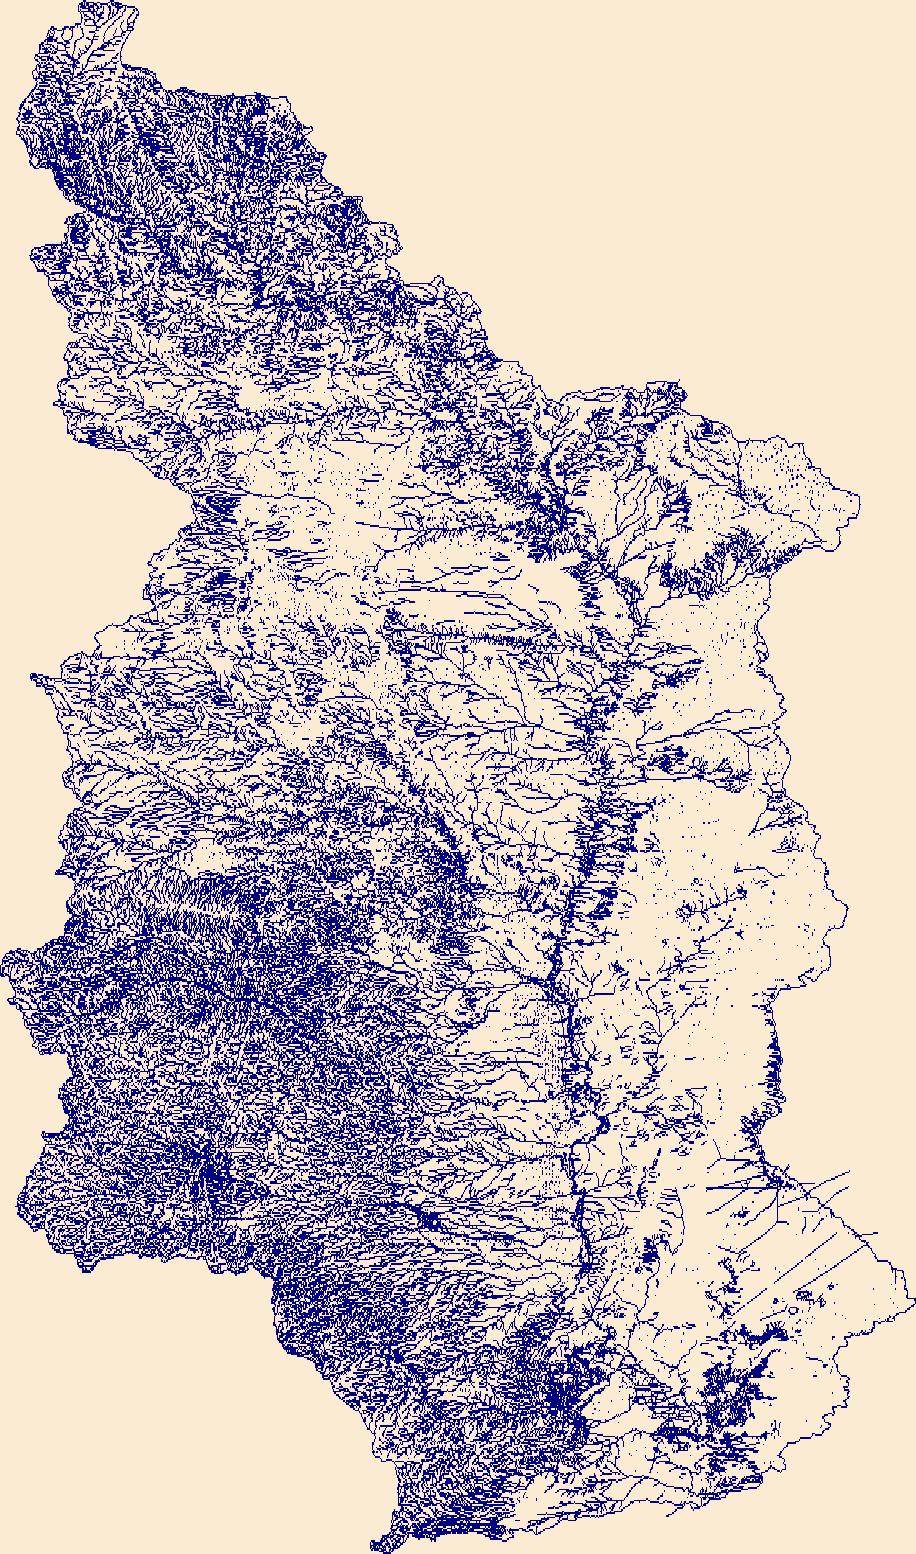
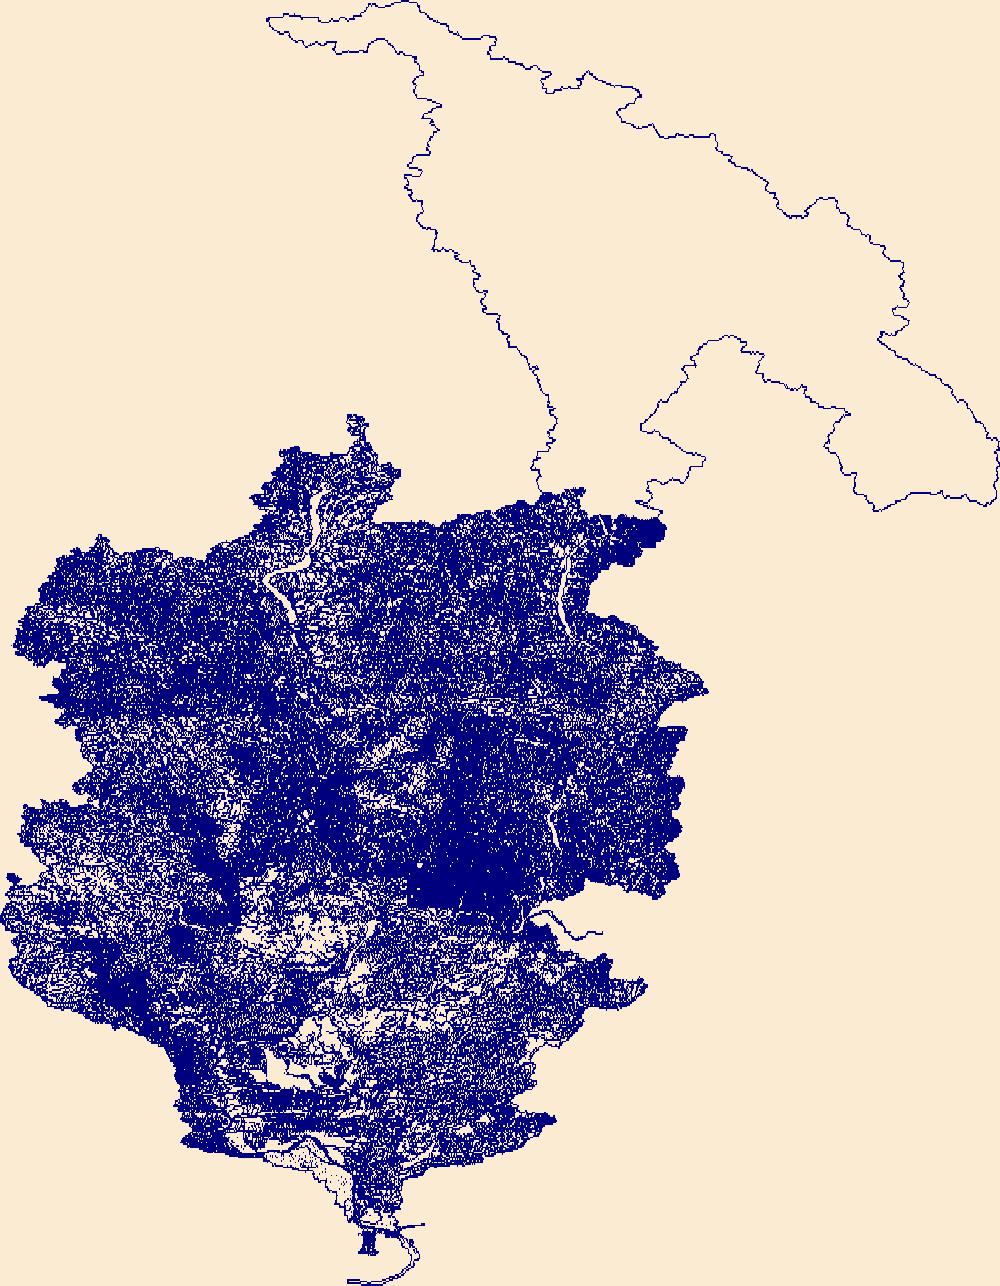
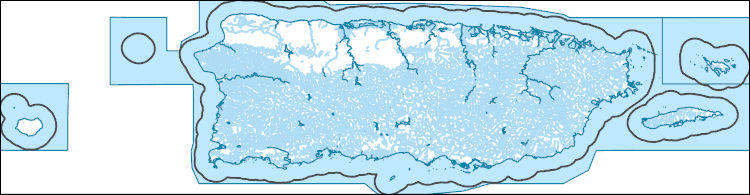
The High Resolution National Hydrography Dataset Plus (NHDPlus HR) is an integrated set of geospatial data layers, including the best available National Hydrography Dataset (NHD), the 10-meter 3D Elevation Program Digital Elevation Model (3DEP DEM), and the National Watershed Boundary Dataset (WBD). The NHDPlus HR combines the NHD, 3DEP DEMs, and WBD to create a stream network with linear referencing, feature naming, "value added attributes" (VAAs), elevation-derived catchments, and other features for hydrologic data analysis. The stream network with linear referencing is a system of data relationships applied to hydrographic systems so that one stream reach "flows" into another and "events" can be tied to and traced...
The High Resolution National Hydrography Dataset Plus (NHDPlus HR) is an integrated set of geospatial data layers, including the best available National Hydrography Dataset (NHD), the 10-meter 3D Elevation Program Digital Elevation Model (3DEP DEM), and the National Watershed Boundary Dataset (WBD). The NHDPlus HR combines the NHD, 3DEP DEMs, and WBD to create a stream network with linear referencing, feature naming, "value added attributes" (VAAs), elevation-derived catchments, and other features for hydrologic data analysis. The stream network with linear referencing is a system of data relationships applied to hydrographic systems so that one stream reach "flows" into another and "events" can be tied to and traced...
The High Resolution National Hydrography Dataset Plus (NHDPlus HR) is an integrated set of geospatial data layers, including the best available National Hydrography Dataset (NHD), the 10-meter 3D Elevation Program Digital Elevation Model (3DEP DEM), and the National Watershed Boundary Dataset (WBD). The NHDPlus HR combines the NHD, 3DEP DEMs, and WBD to create a stream network with linear referencing, feature naming, "value added attributes" (VAAs), elevation-derived catchments, and other features for hydrologic data analysis. The stream network with linear referencing is a system of data relationships applied to hydrographic systems so that one stream reach "flows" into another and "events" can be tied to and traced...
The High Resolution National Hydrography Dataset Plus (NHDPlus HR) is an integrated set of geospatial data layers, including the best available National Hydrography Dataset (NHD), the 10-meter 3D Elevation Program Digital Elevation Model (3DEP DEM), and the National Watershed Boundary Dataset (WBD). The NHDPlus HR combines the NHD, 3DEP DEMs, and WBD to create a stream network with linear referencing, feature naming, "value added attributes" (VAAs), elevation-derived catchments, and other features for hydrologic data analysis. The stream network with linear referencing is a system of data relationships applied to hydrographic systems so that one stream reach "flows" into another and "events" can be tied to and traced...
The High Resolution National Hydrography Dataset Plus (NHDPlus HR) is an integrated set of geospatial data layers, including the best available National Hydrography Dataset (NHD), the 10-meter 3D Elevation Program Digital Elevation Model (3DEP DEM), and the National Watershed Boundary Dataset (WBD). The NHDPlus HR combines the NHD, 3DEP DEMs, and WBD to create a stream network with linear referencing, feature naming, "value added attributes" (VAAs), elevation-derived catchments, and other features for hydrologic data analysis. The stream network with linear referencing is a system of data relationships applied to hydrographic systems so that one stream reach "flows" into another and "events" can be tied to and traced...
The High Resolution National Hydrography Dataset Plus (NHDPlus HR) is an integrated set of geospatial data layers, including the best available National Hydrography Dataset (NHD), the 10-meter 3D Elevation Program Digital Elevation Model (3DEP DEM), and the National Watershed Boundary Dataset (WBD). The NHDPlus HR combines the NHD, 3DEP DEMs, and WBD to create a stream network with linear referencing, feature naming, "value added attributes" (VAAs), elevation-derived catchments, and other features for hydrologic data analysis. The stream network with linear referencing is a system of data relationships applied to hydrographic systems so that one stream reach "flows" into another and "events" can be tied to and traced...
The High Resolution National Hydrography Dataset Plus (NHDPlus HR) is an integrated set of geospatial data layers, including the best available National Hydrography Dataset (NHD), the 10-meter 3D Elevation Program Digital Elevation Model (3DEP DEM), and the National Watershed Boundary Dataset (WBD). The NHDPlus HR combines the NHD, 3DEP DEMs, and WBD to create a stream network with linear referencing, feature naming, "value added attributes" (VAAs), elevation-derived catchments, and other features for hydrologic data analysis. The stream network with linear referencing is a system of data relationships applied to hydrographic systems so that one stream reach "flows" into another and "events" can be tied to and traced...
The High Resolution National Hydrography Dataset Plus (NHDPlus HR) is an integrated set of geospatial data layers, including the best available National Hydrography Dataset (NHD), the 10-meter 3D Elevation Program Digital Elevation Model (3DEP DEM), and the National Watershed Boundary Dataset (WBD). The NHDPlus HR combines the NHD, 3DEP DEMs, and WBD to create a stream network with linear referencing, feature naming, "value added attributes" (VAAs), elevation-derived catchments, and other features for hydrologic data analysis. The stream network with linear referencing is a system of data relationships applied to hydrographic systems so that one stream reach "flows" into another and "events" can be tied to and traced...
The High Resolution National Hydrography Dataset Plus (NHDPlus HR) is an integrated set of geospatial data layers, including the best available National Hydrography Dataset (NHD), the 10-meter 3D Elevation Program Digital Elevation Model (3DEP DEM), and the National Watershed Boundary Dataset (WBD). The NHDPlus HR combines the NHD, 3DEP DEMs, and WBD to create a stream network with linear referencing, feature naming, "value added attributes" (VAAs), elevation-derived catchments, and other features for hydrologic data analysis. The stream network with linear referencing is a system of data relationships applied to hydrographic systems so that one stream reach "flows" into another and "events" can be tied to and traced...
This part of the Data Release contains the raster representation of the water-level altitude and water-level change maps developed every 5 years from 1980-2015 for the upper Rio Grande Focus Area Study. The input point data used to generate the water-level altitude maps can be found in the "Groundwater level measurement data used to develop water-level altitude maps in the upper Rio Grande Alluvial Basins" child item of this data release. These digital data accompany Houston, N.A., Thomas, J.V., Foster, L.K., Pedraza, D.E., and Welborn, T.L., 2020, Hydrogeologic framework, groundwater-level altitudes, groundwater-level changes, and groundwater-storage changes in selected alluvial basins of the upper Rio Grande...
Types: Map Service,
OGC WFS Layer,
OGC WMS Layer,
OGC WMS Service;
Tags: Abiquiu Reservoir,
Ahumada,
Alamosa,
Alamosa County,
Alamosa Creek,
From May 2017 to November 2019, the U.S. Geological Survey conducted bathymetric surveys of New York City's East of Hudson Reservoirs. Bathymetry data were collected at Kirk Lake during June 2017. Depth data were collected primarily with a multibeam echosounder. Quality assurance points were measured with a single-beam echosounder. Water surface elevations were established using real-time kinematic (RTK) and static global navigation satellite system (GNSS) surveys and submersible pressure transducers. Measured sound velocity profiles were used to correct echosounder depth measurements for thermal stratification. Digital elevation models were created by combining the measured bathymetry data with lidar elevation...
Categories: Data;
Types: Downloadable,
GeoTIFF,
Map Service,
OGC WFS Layer,
OGC WMS Layer,
Raster,
Shapefile;
Tags: Ambient Monitoring,
Basin & Hydrogeologic Characterization,
Kirk Lake,
New York,
Putnam County,
From May 2017 to November 2019, the U.S. Geological Survey conducted bathymetric surveys of New York City's East of Hudson Reservoirs. Bathymetry data were collected at Lake Gleneida during May 2017. Depth data were collected primarily with a multibeam echosounder. Quality assurance points were measured with a single-beam echosounder. Water surface elevations were established using real-time kinematic (RTK) and static global navigation satellite system (GNSS) surveys and submersible pressure transducers. Measured sound velocity profiles were used to correct echosounder depth measurements for thermal stratification. Digital elevation models were created by combining the measured bathymetry data with lidar elevation...
Categories: Data;
Types: Downloadable,
GeoTIFF,
Map Service,
OGC WFS Layer,
OGC WMS Layer,
Raster,
Shapefile;
Tags: Ambient Monitoring,
Basin & Hydrogeologic Characterization,
Lake Gleneida,
New York,
Putnam County,
Water velocities and water-quality constituents were measured along planned survey lines, which were generally perpendicular to the shoreline and spaced 100 meters apart, over an approximately 2.3-mile section of nearshore Lake Erie on June 10-12, 2019 (survey 1), and August 19-21, 2019 (survey 2), using a 1200 kHz acoustic Doppler current profiler (ADCP), a YSI 6920 V2 multiparameter sonde, and a YSI EcoMapper autonomous underwater vehicle (AUV). Water-quality data collected in this area included near-surface and three-dimensional measurements of water temperature, specific conductance, pH, dissolved oxygen, turbidity, chlorophyll, and phycocyanin (blue-green algae). The data were geo-referenced with an integrated...
Categories: Data;
Tags: Cleveland,
Easterly Wastewater Treatment Plant (WWTP),
EcoMapper,
Euclid Creek,
Lake Erie,
The goal of this study was to develop a suite of inter-related water quality monitoring approaches capable of modeling and estimating spatial and temporal gradients of particulate and dissolved total mercury (THg) concentration, and particulate and dissolved methyl mercury (MeHg), concentration, in surface waters across the Sacramento / San Joaquin River Delta (SSJRD). This suite of monitoring approaches included: a) data collection at fixed continuous monitoring stations (CMS) outfitted with in-situ sensors, b) spatial mapping using boat-mounted flow-through sensors, and c) satellite-based remote sensing. The focus of this specific Child Page is to document a series of derived remote sensing products for turbidity...
Predictions of raven occurrence intersected with high impact areas for sage-grouse populations. The index highlights regions where elevated raven occurrence is likely to impact breeding sage-grouse.
Categories: Data;
Types: ArcGIS REST Map Service,
ArcGIS Service Definition,
Downloadable,
Map Service;
Tags: Great Basin,
biota,
geographic information systems (GIS),
geospatial analysis,
habitat alteration,
Minimum convex polygons created from survey locations at associated study sites.
Categories: Data;
Types: Downloadable,
Map Service,
OGC WFS Layer,
OGC WMS Layer,
Shapefile;
Tags: Great Basin,
boundaries,
geographic information systems (GIS),
geospatial analysis,
habitat alteration,
This data release has been deprecated. Please see new data release here: https://doi.org/10.5066/P9CIK9ZF. This data release documents the digital data used to produce flood-inundation maps for a range of gage heights (stages) for the Sabinal River near Utopia, Tex. The simulated flood-inundation maps correspond to a range in stage from 7 to 24 feet (ft) at U.S. Geological Survey (USGS) streamgage 08197970 Sabinal River at Utopia, Tex. at intervals of 0.5-ft. The maps were created for a 10-mile reach of the Sabinal River from USGS streamgage 08197936 Sabinal River below Mill Creek near Vanderpool, Tex., at the upstream boundary of the study reach, to USGS streamgage 08197970 Sabinal River at Utopia, Tex. (hereinafter...
Digital flood-inundation maps for a 9.3-mile reach of the Iowa River along the Meskwaki Settlement, Iowa, were created by the U.S. Geological Survey (USGS) in cooperation with the Sac and Fox Tribe of the Mississippi River in Iowa. The flood-inundation maps, which can be accessed through the USGS Flood Inundation Mapping Science web site at https://water.usgs.gov/osw/flood_inundation/ depict estimates of the areal extent and depth of flooding corresponding to selected water levels (stages) at the USGS streamgage 05451770 on the Iowa River at County Highway E49 near Tama, Iowa. Near-real-time stages at this streamgage may be obtained on the internet from the USGS National Water Information System at https://waterdata.usgs.gov/...
Categories: Data;
Types: Downloadable,
GeoTIFF,
Map Service,
Raster;
Tags: Iowa,
Iowa River,
Meskwaki Settlement,
biota,
flood,
Understanding how sea-level rise will affect coastal landforms and the species and habitats they support is critical for developing approaches that balance the needs of humans and native species. Given the magnitude of the threat posed by sea-level rise, and the urgency to better understand it, there is an increasing need to forecast sea-level rise effects on barrier islands. To address this problem, scientists in the U.S. Geological Survey (USGS) Coastal and Marine Geology program are developing Bayesian networks as a tool to evaluate and to forecast the effects of sea-level rise on shoreline change, barrier island geomorphology, and habitat availability for species such as the piping plover (Charadrius melodus)...
Understanding how sea-level rise will affect coastal landforms and the species and habitats they support is critical for developing approaches that balance the needs of humans and native species. Given the magnitude of the threat posed by sea-level rise, and the urgency to better understand it, there is an increasing need to forecast sea-level rise effects on barrier islands. To address this problem, scientists in the U.S. Geological Survey (USGS) Coastal and Marine Geology program are developing Bayesian networks as a tool to evaluate and to forecast the effects of sea-level rise on shoreline change, barrier island geomorphology, and habitat availability for species such as the piping plover (Charadrius melodus)...
Categories: Data;
Types: Downloadable,
Map Service,
OGC WFS Layer,
OGC WMS Layer,
Shapefile;
Tags: Assateague Island,
Assateague Island,
Assateague Island National Seashore,
Assateague Island National Seashore,
Atlantic Ocean,
|

|
