Filters
Date Range
Types
Contacts
Tag Types
Tag Schemes
|
Modal vegetation class over 1986 – 2005, simulated with MC1 (Lenihan et al. 2008) and a 10 km x 10 km grid cell size. Grid Value: Vegetation Type 1: ALPINE 2: SUBALPINE FOREST 3: COAST EVERGREEN FOREST 11: PINYON-JUNIPER 4: SIERRAN EVERGREEN FOREST 6: MIXED EVERGREEN FOREST 15: GREAT BASIN EVERGREEN WOODLAND 10: MIXED EVERGREEN WOODLAND 20: SAGEBRUSH STEPPE 17: C3 GRASSLAND 18: C4 GRASSLAND 19: CHAPARRAL 17: C3 GRASSLAND 18: C4 GRASSLAND 21: DESERT

Mean annual precipitation (mm) averaged over 2046-2065 from the general circulation model PCM1 (Washington et al. 2000; Meehl et al. 2003) under the A2 emission scenario with a grid cell size of 10 km x 10km. References: Meehl, G.A., W.M. Washington, T.M.L. Wigley, J.M. Arblaster, and A. Dai. 2003. Solar and greenhouse gas forcing and climate response in the twentieth century. J Climate 16:426–444. Washington, W.M., J.W. Weatherly, G.A. Meehl, A.J. Semtner, T.W. Bettge, A.P. Craig, W.G. Stran, J. Arblaster, V.B. Wayland, R. James , and Y. Zhang. 2000. Parallel climate model (PCM) control and transient simulations. Clim Dyn 16: 755–774.

Mean minimum temperature (°C) averaged over 2076-2095 from the general circulation model PCM1 (Washington et al. 2000; Meehl et al. 2003) under the A2 emission scenario with a grid cell size of 10 km x 10km. References: Meehl, G.A., W.M. Washington, T.M.L. Wigley, J.M. Arblaster, and A. Dai. 2003. Solar and greenhouse gas forcing and climate response in the twentieth century. J Climate 16:426–444. Washington, W.M., J.W. Weatherly, G.A. Meehl, A.J. Semtner, T.W. Bettge, A.P. Craig, W.G. Stran, J. Arblaster, V.B. Wayland, R. James , and Y. Zhang. 2000. Parallel climate model (PCM) control and transient simulations. Clim Dyn 16: 755–774.

Mean minimum temperature (°C) averaged over 2046-2065 from the general circulation model PCM1 (Washington et al. 2000; Meehl et al. 2003) under the A2 emission scenario with a grid cell size of 10 km x 10km. References: Meehl, G.A., W.M. Washington, T.M.L. Wigley, J.M. Arblaster, and A. Dai. 2003. Solar and greenhouse gas forcing and climate response in the twentieth century. J Climate 16:426–444. Washington, W.M., J.W. Weatherly, G.A. Meehl, A.J. Semtner, T.W. Bettge, A.P. Craig, W.G. Stran, J. Arblaster, V.B. Wayland, R. James , and Y. Zhang. 2000. Parallel climate model (PCM) control and transient simulations. Clim Dyn 16: 755–774.

Mean maximum temperature (°C) averaged over 2046-2065 from the general circulation model PCM1 (Washington et al. 2000; Meehl et al. 2003) under the A2 emission scenario with a grid cell size of 10 km x 10km. References: Meehl, G.A., W.M. Washington, T.M.L. Wigley, J.M. Arblaster, and A. Dai. 2003. Solar and greenhouse gas forcing and climate response in the twentieth century. J Climate 16:426–444. Washington, W.M., J.W. Weatherly, G.A. Meehl, A.J. Semtner, T.W. Bettge, A.P. Craig, W.G. Stran, J. Arblaster, V.B. Wayland, R. James , and Y. Zhang. 2000. Parallel climate model (PCM) control and transient simulations. Clim Dyn 16: 755–774.

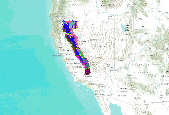
Simulated fraction of vegetation carbon in forest averaged over 2046-2065 simulated by MC1 (Hayhoe et al. 2004) at a 10 km x 10 km grid cell size under Hadley CM3 (Gordon et al. 2000, Pope et al. 2000) climate projections with A1fi emission levels (Nakic’enovic’ et al. 2000). References: Gordon C., C. Cooper , C.A. Senior, H. Banks, J.M. Gregory, T.C. Johns , J.F.B. Mitchell, and R.A. Wood. 2000. The simulation of SST, sea ice extents and ocean heat transports in a version of the Hadley Centre coupled model without flux adjustments. Clim Dyn 16:147–168. Nakic’enovic’ N, Alcamo J, Davis G, de Vries B, Fenhann J, Gaffin S, Gregory K, Grubler A, Jung TY, Kram T et al. 2000. Intergovernmental panel on climate...
Tags: california,
climate,
climate change,
cm3,
dynamic vegetation model, All tags...
hadley,
mc1,
north america,
simulated fraction of vegetation carbon in forest,
usa,
yale, Fewer tags

MC1 is a dynamic vegetation model for estimating the distribution of vegetation and associated ecosystem fluxes of carbon, nutrients, and water. It was created to assess the potential impacts of global climate change on ecosystem structure and function at a wide range of spatial scales from landscape to global. The model incorporates transient dynamics to make predictions about the patterns of ecological change. MC1 was created by combining physiologically based biogeographic rules defined in the MAPSS model with a modified version of the biogeochemical model, CENTURY. MC1 includes a fire module, MCFIRE, that mechanistically simulates the occurrence and impacts of fire events. Climate input data sources for this...
Tags: a1b,
canada,
climate change,
global circulation model,
hadcm3, All tags...
hadley,
model,
north america,
prism,
simulation,
usa,
vegetation type, Fewer tags

This data set contains imagery from the National Agriculture Imagery Program (NAIP). The NAIP program is administered by USDA FSA and has been established to support two main FSA strategic goals centered on agricultural production. These are, increase stewardship of America's natural resources while enhancing the environment, and to ensure commodities are procured and distributed effectively and efficiently to increase food security. The NAIP program supports these goals by acquiring and providing ortho imagery that has been collected during the agricultural growing season in the U.S. The NAIP ortho imagery is tailored to meet FSA requirements and is a fundamental tool used to support FSA farm and conservation programs....
Types: Citation;
Tags: 21227,
3.75 x 3.75 minute,
3708660,
Aerial Compliance,
Compliance, All tags...
Digital Ortho rectified Image,
Downloadable Data,
HADLEY,
HADLEY, NW,
JPEG2000,
KY,
KY227,
NAIP,
Ortho Rectification,
Orthoimagery,
Quarter Quadrangle,
USDA National Agriculture Imagery Program (NAIP),
WARREN CO KY FSA,
Warren,
farming, Fewer tags
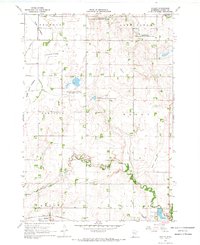
USGS Historical Quadrangle in GeoPDF.
Tags: 7.5 x 7.5 minute,
Downloadable Data,
GeoPDF,
GeoTIFF,
Hadley, All tags...
Historical Topographic Maps,
Historical Topographic Maps 7.5 x 7.5 Minute Map Series,
MN,
Map,
imageryBaseMapsEarthCover, Fewer tags
This data set contains imagery from the National Agriculture Imagery Program (NAIP). The NAIP program is administered by USDA FSA and has been established to support two main FSA strategic goals centered on agricultural production. These are, increase stewardship of America's natural resources while enhancing the environment, and to ensure commodities are procured and distributed effectively and efficiently to increase food security. The NAIP program supports these goals by acquiring and providing ortho imagery that has been collected during the agricultural growing season in the U.S. The NAIP ortho imagery is tailored to meet FSA requirements and is a fundamental tool used to support FSA farm and conservation programs....
Types: Citation;
Tags: 27101,
3.75 x 3.75 minute,
4409558,
Aerial Compliance,
Compliance, All tags...
Digital Ortho rectified Image,
Downloadable Data,
HADLEY,
HADLEY, NE,
JPEG2000,
MN,
MN101,
MURRAY CO MN FSA,
Murray,
NAIP,
Ortho Rectification,
Orthoimagery,
Quarter Quadrangle,
USDA National Agriculture Imagery Program (NAIP),
farming, Fewer tags
This data set contains imagery from the National Agriculture Imagery Program (NAIP). The NAIP program is administered by USDA FSA and has been established to support two main FSA strategic goals centered on agricultural production. These are increase stewardship of America's natural resources while enhancing the environment, and to ensure commodities are procured and distributed effectively and efficiently to increase food security. The NAIP program supports these goals by acquiring and providing ortho imagery that has been collected during the agricultural growing season in the U.S. The NAIP ortho imagery is tailored to meet FSA requirements and is a fundamental tool used to support FSA farm and conservation programs....
Types: Citation;
Tags: 26087,
3.75 x 3.75 minute,
4208305,
Aerial Compliance,
Compliance, All tags...
Digital Ortho rectified Image,
Downloadable Data,
HADLEY,
HADLEY, NE,
JPEG 2000,
JPEG2000,
LAPEER CO MI FSA,
Lapeer,
MI,
MI087,
NAIP,
Ortho Rectification,
Orthoimagery,
Quarter Quadrangle,
USDA National Agriculture Imagery Program (NAIP),
farming,
imageryBaseMapsEarthCover, Fewer tags
Simulated average maximum tree LAI (m2/m2) averaged over 2046-2065 simulated by the MC1 dynamic global vegetation model (Bachelet et al. 2001) at a 800 m x 800 m spatial resolution using future climate projections provided through CMIP3 (http://www-pcmdi.llnl.gov/ipcc/about_ipcc.php). Future climate drivers were generated using statistical downscaling (simple delta method) of general circulation model projections, in this case Hadley CM3 (Johns et al. 2003) under the A2 emission scenario (Naki?enovi? et al. 2000). The deltas (differences for temperatures and ratios for precipitation) were used to modify PRISM 800 m historical baseline (Daly et al. 2008). Note: The MC1 model is described in data basin (http://databasin.org/climate-center/features/mc1-dynamic-global-vegetation-...

Fraction of vegetation carbon burned averaged over 2046-2065 simulated by the MC1 dynamic global vegetation model (Bachelet et al. 2001) at a 800 m x 800 m spatial resolution using future climate projections provided through CMIP3 (http://www-pcmdi.llnl.gov/ipcc/about_ipcc.php). Future climate drivers were generated using statistical downscaling (simple delta method) of general circulation model projections, in this case Hadley CM3 (Johns et al. 2003) under the A2 emission scenario (Naki?enovi? et al. 2000). The deltas (differences for temperatures and ratios for precipitation) were used to modify PRISM 800 m historical baseline (Daly et al. 2008). Note: The MC1 model is described in data basin (http://databasin.org/climate-center/features/mc1-dynamic-global-vegetation-model)...

Simulated potential evapotranspiration (mm) averaged over 2046-2065 simulated by the MC1 dynamic global vegetation model (Bachelet et al. 2001) at a 800 m x 800 m spatial resolution using future climate projections provided through CMIP3 (http://www-pcmdi.llnl.gov/ipcc/about_ipcc.php). Future climate drivers were generated using statistical downscaling (simple delta method) of general circulation model projections, in this case Hadley CM3 (Johns et al. 2003) under the A2 emission scenario (Naki?enovi? et al. 2000). The deltas (differences for temperatures and ratios for precipitation) were used to modify PRISM 800 m historical baseline (Daly et al. 2008). Note: The MC1 model is described in data basin (http://databasin.org/climate-center/features/mc1-dynamic-global-vegetation...

Future winter (January – March) minimum temperature (°C, averaged over 2046-2065) at a 4 km x 4 km spatial resolution using future climate projections provided through CMIP3 (http://www-pcmdi.llnl.gov/ipcc/about_ipcc.php). Future climate drivers were generated using statistical downscaling (simple delta method) of general circulation model projections, in this case Hadley CM3 (Johns et al. 2003) under the A2 emission scenario (Naki?enovi? et al. 2000). The deltas (differences for temperatures and ratios for precipitation) were used to modify PRISM 4km historical baseline (Daly et al. 1994). Note: The MC1 model is described in data basin (http://databasin.org/climate-center/features/mc1-dynamic-global-vegetation-model)....

Future modal vegetation class over 2076-2095 simulated with the MC1 dynamic global vegetation model (Bachelet et al. 2001) at a 4 km x 4 km spatial resolution using future climate projections provided through CMIP3 (http://www-pcmdi.llnl.gov/ipcc/about_ipcc.php). Future climate drivers were generated using statistical downscaling (simple delta method) of general circulation model projections, in this case Hadley CM3 (Johns et al. 2003) under the A2 emission scenario (Naki?enovi? et al. 2000). The deltas (differences for temperatures and ratios for precipitation) were used to modify PRISM 4km historical baseline (Daly et al. 1994). Note: The MC1 model is described in data basin (http://databasin.org/climate-center/features/mc1-dynamic-global-vegetation-model)....

This map represents the change between 1971-2000 and 2070-2099 in the annual peak fraction of total live vegetation carbon held in herbaceous plants, as simulated by the model MC1 under the Hadley future climate projection and A2 anthropogenic emissions scenario. The fraction of total live vegetation carbon held in herbaceous plants for the respective 30-year periods increased in some of the 5,311 grid cells of the Apache-Sitgreaves study area and decreased in others.The range of data values is from -0.817 to +0.999. The mean value is +0.210. Data values are calculated as GFRAC(2070-2099) minus GFRAC(1971-2000). GFRAC data is from MC1 version B60. The vegetation model MC1 (e.g. Bachelet et al. 2001) was used...
Tags: biotic community,
burned area,
carbon,
climate,
fire, All tags...
hadley,
mc1,
model,
prism,
regime,
simulation,
vegetation, Fewer tags

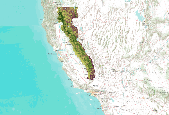
Simulated forest carbon (g C m2) averaged over 2076-2095 simulated by MC1 (Hayhoe et al. 2004) at a 10 km x 10 km grid cell size under Hadley CM3 (Gordon et al. 2000, Pope et al. 2000) climate projections with A1fi emission levels (Nakic’enovic’ et al. 2000). References: Gordon C., C. Cooper , C.A. Senior, H. Banks, J.M. Gregory, T.C. Johns , J.F.B. Mitchell, and R.A. Wood. 2000. The simulation of SST, sea ice extents and ocean heat transports in a version of the Hadley Centre coupled model without flux adjustments. Clim Dyn 16:147–168. Nakic’enovic’ N, Alcamo J, Davis G, de Vries B, Fenhann J, Gaffin S, Gregory K, Grubler A, Jung TY, Kram T et al. 2000. Intergovernmental panel on climate change special report...
Tags: california,
climate,
climate change,
cm3,
dynamic vegetation model, All tags...
hadley,
mc1,
north america,
simulated forest carbon,
usa,
yale, Fewer tags
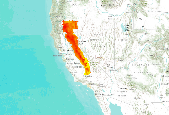
Simulated fraction of vegetation carbon burned averaged over 2046-2065 simulated by MC1 (Hayhoe et al. 2004) at a 10 km x 10 km grid cell size under Hadley CM3 (Gordon et al. 2000, Pope et al. 2000) climate projections with A1fi emission levels (Nakic’enovic’ et al. 2000). References: Gordon C., C. Cooper , C.A. Senior, H. Banks, J.M. Gregory, T.C. Johns , J.F.B. Mitchell, and R.A. Wood. 2000. The simulation of SST, sea ice extents and ocean heat transports in a version of the Hadley Centre coupled model without flux adjustments. Clim Dyn 16:147–168. Nakic’enovic’ N, Alcamo J, Davis G, de Vries B, Fenhann J, Gaffin S, Gregory K, Grubler A, Jung TY, Kram T et al. 2000. Intergovernmental panel on climate change...
Tags: california,
climate,
climate change,
cm3,
dynamic vegetation model, All tags...
hadley,
mc1,
north america,
simulated fraction of vegetation carbon burned,
usa,
yale, Fewer tags

MC1 is a dynamic vegetation model for estimating the distribution of vegetation and associated ecosystem fluxes of carbon, nutrients, and water. It was created to assess the potential impacts of global climate change on ecosystem structure and function at a wide range of spatial scales from landscape to global. The model incorporates transient dynamics to make predictions about the patterns of ecological change. MC1 was created by combining physiologically based biogeographic rules defined in the MAPSS model with a modified version of the biogeochemical model, CENTURY. MC1 includes a fire module, MCFIRE, that mechanistically simulates the occurrence and impacts of fire events. Climate input data sources for this...
Tags: a2,
canada,
climate change,
global circulation model,
hadcm3, All tags...
hadley,
model,
north america,
prism,
simulation,
usa,
vegetation type, Fewer tags
|
|

