Filters: Tags: huc5 (X) > partyWithName: Conservation Biology Institute (X)
53 results (22ms)|
Filters
|

This dataset represents the average amount of soil carbon within each HUC5 watershed, simulated by the model MC1 for the 30-year period 1971-2000. Soil carbon, in g m-2, was determined for each HUC5 watershed. Watersheds represent 5th level (HUC5, 10-digit) hydrologic unit boundaries and were acquired from the Natural Resources Conservation Service. Background: The dynamic global vegetation model MC1 (see Bachelet et al.2001) was used to simulate vegetation dynamics, associated carbon and nitrogen cycle, water budget, and wild fire impacts for OR, WA, AZ and NM, for a project funded by the USDA Forest Service (PNW09-JV-11261900-003). The MC1 model was run using historical data and future climate change projections...
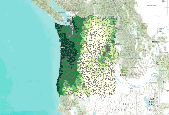
This dataset represents the average net primary production for each HUC5 watershed, simulated by the model MC1 for the 30-year period 1971-2000. Mean net primary production (in g m-2 per yr), was determined for each HUC5 watershed by averaging values of original ~ 4 km raster data. Watersheds represent 5th level (HUC5, 10-digit) hydrologic unit boundaries and were acquired from the Natural Resources Conservation Service. Background: The dynamic global vegetation model MC1 (see Bachelet et al.2001) was used to simulate vegetation dynamics, associated carbon and nitrogen cycle, water budget, and wild fire impacts for OR, WA, AZ and NM, for a project funded by the USDA Forest Service (PNW09-JV-11261900-003). The MC1...

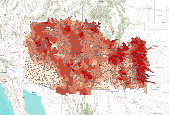
Percent change in the average surface runoff for each HUC5 watershed between historical (1971-2000) and future (2071-2100) time periods. The MC1 dynamic vegetation model was run under the CSIRO, MIROC, and Hadley climate change projections and the A2 anthropogenic emissions scenario.Simulated mean annual surface runoff (in mm H2O yr-1), was determined for each HUC5 watershed by averaging values of original ~ 4 km raster data. Watersheds represent 5th level (HUC5, 10-digit) hydrologic unit boundaries and were acquired from the Natural Resources Conservation Service. Background: The dynamic global vegetation model MC1 (see Bachelet et al. 2001) was used to simulate vegetation dynamics, associated carbon and nitrogen...

Percent change in the mean area burned per year (per ~4 km pixel ) for each HUC5 watershed between historical (1971-2000) and future (2071-2100) time periods. The MC1 dynamic vegetation model was run under the CSIRO, MIROC, and Hadley climate change projections and the A2 anthropogenic emissions scenario.Mean area burned per year per ~4 km pixel, (in square meters), was determined for each HUC5 watershed. Watersheds represent 5th level (HUC5, 10-digit) hydrologic unit boundaries and were acquired from the Natural Resources Conservation Service. Background: The dynamic global vegetation model MC1 (see Bachelet et al. 2001) was used to simulate vegetation dynamics, associated carbon and nitrogen cycle, water budget,...
This dataset represents the average amount of Growing Degree Days (GDD) per year within each HUC5 watershed, simulated by the model MC1 for the 30-year period 1971-2000. Growing degree days (referenced to 0oC) (unit = deg C days) were determined for each HUC5 watershed. Watersheds represent 5th level (HUC5, 10-digit) hydrologic unit boundaries. They were acquired from the Natural Resources Conservation Service. Background: The dynamic global vegetation model MC1 (see Bachelet et al. 2001) was used to simulate vegetation dynamics, associated carbon and nitrogen cycle, water budget, and wild fire impacts for OR, WA, AZ and NM, for a project funded by the USDA Forest Service (PNW 09-JV-11261900-003). The MC1 model...

This dataset represents the historical mean number of fires per year burned per ~ 4 km pixel, averaged for each HUC5 watershed, simulated by the model MC1 for the 30-year period 1971-2000. Historical mean number of fires per year per ~4 km pixel was averaged across each HUC5 watershed. Watersheds represent 5th level (HUC5, 10-digit) hydrologic unit boundaries and were acquired from the Natural Resources Conservation Service. Background: The dynamic global vegetation model MC1 (see Bachelet et al.2001) was used to simulate vegetation dynamics, associated carbon and nitrogen cycle, water budget, a nd wild fire impacts for OR, WA, AZ and NM, for a project funded by the USDA Forest Service (PNW09-JV-11261900-003)....

This dataset represents the average amount of Growing Degree Days (GDD) per year within each HUC5 watershed. Growing degree days (referenced to 0oC) (unit = deg C days) were determined for each HUC5 watershed. Watersheds represent 5th level (HUC5, 10-digit) hydrologic unit boundaries. They were acquired from the Natural Resources Conservation Service. Background: The dynamic global vegetation model MC1 (see Bachelet et al. 2001) was used to simulate vegetation dynamics, associated carbon and nitrogen cycle, water budget, and wild fire impacts for OR, WA, AZ and NM, for a project funded by the USDA Forest Service (PNW 09-JV-11261900-003). The MC1 model was run using historical data and future climate change...

Percent change in the average surface runoff for each HUC5 watershed between historical (1971-2000) and future (2071-2100) time periods. The MC1 dynamic vegetation model was run under the CSIRO, MIROC, and Hadley climate change projections and the A2 anthropogenic emissions scenario.Simulated mean annual surface runoff (in mm H2O yr-1), was determined for each HUC5 watershed by averaging values of original ~ 4 km raster data. Watersheds represent 5th level (HUC5, 10-digit) hydrologic unit boundaries and were acquired from the Natural Resources Conservation Service. Background: The dynamic global vegetation model MC1 (see Bachelet et al. 2001) was used to simulate vegetation dynamics, associated carbon and nitrogen...

This dataset represents the average annual precipitation for each HUC5 watershed, simulated by the model MC1 for the 30-year period 1971-2000. Mean annual precipitation (in mm H2O yr-1), was determined for each HUC5 watershed by averaging values of original ~ 4 km raster data. Watersheds represent 5th level (HUC5, 10-digit) hydrologic unit boundaries and were acquired from the Natural Resources Conservation Service. Background: The dynamic global vegetation model MC1 (see Bachelet et al.2001) was used to simulate vegetation dynamics, associated carbon and nitrogen cycle, water budget, and wild fire impacts for OR, WA, AZ and NM, for a project funded by the USDA Forest Service (PNW09-JV-11261900-003). The MC1...
This dataset represents the average carbon consumed by fire for each HUC5 watershed, simulated by the model MC1 for the 30-year period 1971-2000. Carbon in biomass consumed by fire, in g m-2 yr-1, was determined for each HUC5 watershed. Watersheds represent 5th level (HUC5, 10-digit) hydrologic unit boundaries and were acquired from the Natural Resources Conservation Service. Background: The dynamic global vegetation model MC1 (see Bachelet et al. 2001) was used to simulate vegetation dynamics, associated carbon and nitrogen cycle, water budget, and wild fire impacts for OR, WA, OR and WA, for a project funded by the USDA Forest Service (PNW 09-JV-11261900-003). The MC1 model was run using historical data...
This dataset represents the historical majority vegetation type (30 year mode), for each HUC5 watershed, simulated by the model MC1 for the 30-year period 1971-2000. Majority vegetation type was determined for each HUC5 watershed by calculating the 30 year mode from original ~ 4 km raster data. Watersheds represent 5th level (HUC5, 10-digit) hydrologic unit boundaries and were acquired from the Natural Resources Conservation Service. Background: The dynamic global vegetation model MC1 (see Bachelet et al.2001) was used to simulate vegetation dynamics, associated carbon and nitrogen cycle, water budget, a nd wild fire impacts for OR, WA, AZ and NM, for a project funded by the USDA Forest Service (PNW09-JV-11261900-003)....

This dataset represents the average net primary production for each HUC5 watershed, simulated by the model MC1 for the 30-year period 1971-2000. Mean net primary production (in g m-2 per yr), was determined for each HUC5 watershed by averaging values of original ~ 4 km raster data. Watersheds represent 5th level (HUC5, 10-digit) hydrologic unit boundaries and were acquired from the Natural Resources Conservation Service. Background: The dynamic global vegetation model MC1 (see Bachelet et al.2001) was used to simulate vegetation dynamics, associated carbon and nitrogen cycle, water budget, and wild fire impacts for OR, WA, AZ and NM, for a project funded by the USDA Forest Service (PNW09-JV-11261900-003). The...
This dataset represents the historical mean annual area burned per ~ 4 km pixel, averaged for each HUC5 watershed, simulated by the model MC1 for the 30-year period 1971-2000. Historical mean area burned per year (in square meters) per ~4 km pixel was averaged across each HUC5 watershed. Watersheds represent 5th level (HUC5, 10-digit) hydrologic unit boundaries and were acquired from the Natural Resources Conservation Service. Background: The dynamic global vegetation model MC1 (see Bachelet et al.2001) was used to simulate vegetation dynamics, associated carbon and nitrogen cycle, water budget, and wild fire impacts for OR, WA, AZ and NM, for a project funded by the USDA Forest Service (PNW09-JV-11261900-003)....

This dataset represents the average maximum annual value of total vegetation carbon for each HUC5 watershed, simulated by the model MC1 for the 30-year period 1971-2000. Mean maximum annual value of total vegetation carbon in g m-2, was determined for each HUC5 watershed. Watersheds represent 5th level (HUC5, 10-digit) hydrologic unit boundaries and were acquired from the Natural Resources Conservation Service. Background: The dynamic global vegetation model MC1 (see Bachelet et al.2001) was used to simulate vegetation dynamics, associated carbon and nitrogen cycle, water budget, and wild fire impacts for OR, WA, AZ and NM, for a project funded by the USDA Forest Service (PNW09-JV-11261900-003). The MC1 model was...

Percent change in Growing Degree Days (GDD) for each HUC5 watershed between historical (1971-2000) and future (2071-2100) time periods. The MC1 dynamic vegetation model was run under the CSIRO, MIROC, and Hadley climate change projections and the A2 anthropogenic emissions scenario. Growing degree days (referenced to 0oC) (unit = deg C days) were determined for each HUC5 watershed. Watersheds represent 5th level (HUC5, 10-digit) hydrologic unit boundaries. They were acquired from the Natural Resources Conservation Service. Background: The dynamic global vegetation model MC1 (see Bachelet et al. 2001) was used to simulate vegetation dynamics, associated carbon and nitrogen cycle, water budget, and wild fire impacts...
This dataset represents the historical majority vegetation type (30 year mode), for each HUC5 watershed, simulated by the model MC1 for the 30-year period 1971-2000. Majority vegetation type was determined for each HUC5 watershed by calculating the 30 year mode from original ~ 4 km raster data. Watersheds represent 5th level (HUC5, 10-digit) hydrologic unit boundaries and were acquired from the Natural Resources Conservation Service. Background: The dynamic global vegetation model MC1 (see Bachelet et al.2001) was used to simulate vegetation dynamics, associated carbon and nitrogen cycle, water budget, a nd wild fire impacts for OR, WA, AZ and NM, for a project funded by the USDA Forest Service (PNW09-JV-11261900-003)....

This dataset represents the historical mean number of fires per year burned per ~ 4 km pixel, averaged for each HUC5 watershed, simulated by the model MC1 for the 30-year period 1971-2000. Historical mean number of fires per year per ~4 km pixel was averaged across each HUC5 watershed. Watersheds represent 5th level (HUC5, 10-digit) hydrologic unit boundaries and were acquired from the Natural Resources Conservation Service. Background: The dynamic global vegetation model MC1 (see Bachelet et al.2001) was used to simulate vegetation dynamics, associated carbon and nitrogen cycle, water budget, a nd wild fire impacts for OR, WA, AZ and NM, for a project funded by the USDA Forest Service (PNW09-JV-11261900-003)....

This dataset represents the average amount of carbon consumed by fire per year within each HUC5 watershed, simulated by the model MC1 for the 30-year period 1971-2000. Carbon in biomass consumed by fire, in g m-2 yr-1, was determined for each HUC5 watershed. Watersheds represent 5th level (HUC5, 10-digit) hydrologic unit boundaries and were acquired from the Natural Resources Conservation Service. Background: The dynamic global vegetation model MC1 (see Bachelet et al.2001) was used to simulate vegetation dynamics, associated carbon and nitrogen cycle, water budget, and wild fire impacts for OR, WA, AZ and NM, for a project funded by the USDA Forest Service (PNW09-JV-11261900-003). The MC1 model was run using...

This dataset represents the historical mean annual area burned per ~ 4 km pixel, averaged for each HUC5 watershed, simulated by the model MC1 for the 30-year period 1971-2000. Historical mean area burned per year (in square meters) per ~4 km pixel was averaged across each HUC5 watershed. Watersheds represent 5th level (HUC5, 10-digit) hydrologic unit boundaries and were acquired from the Natural Resources Conservation Service. Background: The dynamic global vegetation model MC1 (see Bachelet et al.2001) was used to simulate vegetation dynamics, associated carbon and nitrogen cycle, water budget, and wild fire impacts for OR, WA, AZ and NM, for a project funded by the USDA Forest Service (PNW09-JV-11261900-003)....

Percent change in the mean number of fires per year (per ~4 km pixel ) for each HUC5 watershed between historical (1971-2000) and future (2071-2100) time periods. The MC1 dynamic vegetation model was run under the CSIRO, MIROC, and Hadley climate change projections and the A2 anthropogenic emissions scenario. Mean number of fires per year per ~4 km pixel was determined for each HUC5 watershed. Watersheds represent 5th level (HUC5, 10-digit) hydrologic unit boundaries and were acquired from the Natural Resources Conservation Service. Background: The dynamic global vegetation model MC1 (see Bachelet et al. 2001) was used to simulate vegetation dynamics, associated carbon and nitrogen cycle, water budget, and wild...
|

|
