Filters: Tags: imageryBaseMapsEarthCover (X) > Date Range: {"choice":"month"} (X)
2,470 results (54ms)|
Filters
Date Types (for Date Range)
Types Contacts
Categories Tag Types Tag Schemes |
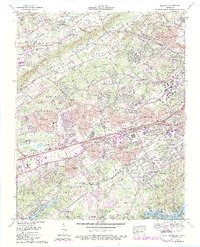
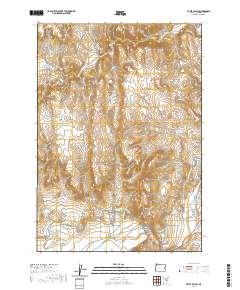
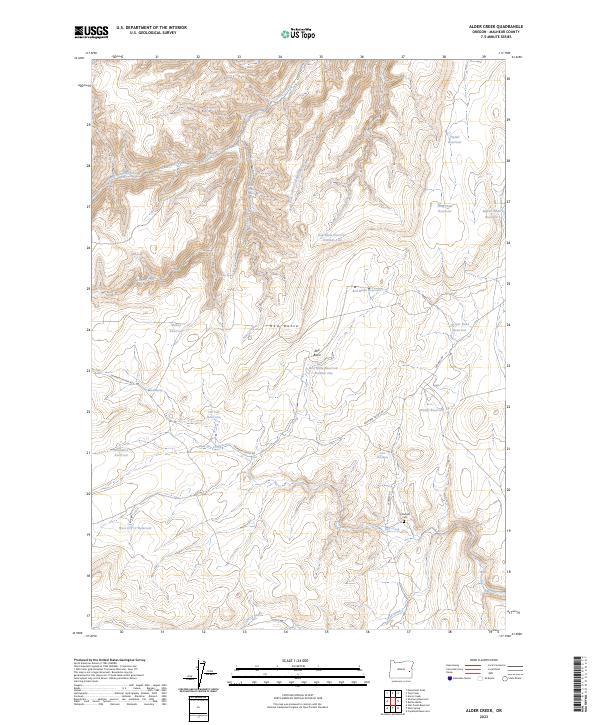
USGS Historical Quadrangle in GeoPDF.
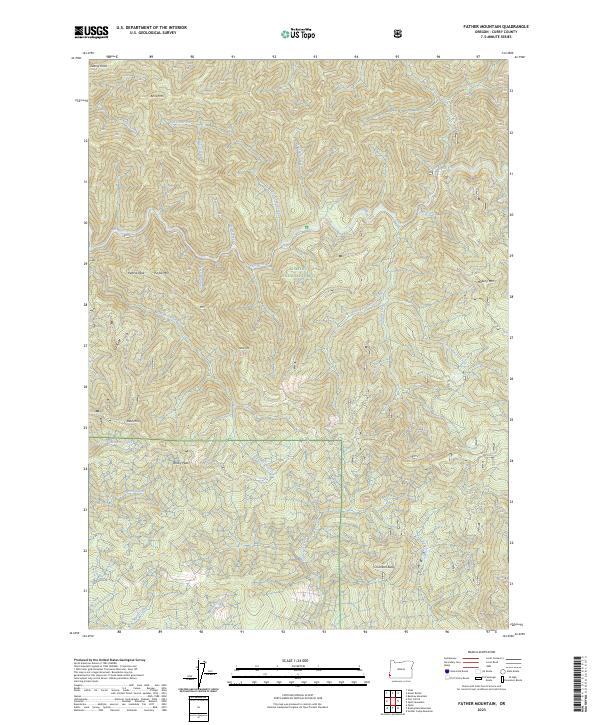
Layered geospatial PDF 7.5 Minute Quadrangle Map. Layers of geospatial data include orthoimagery, roads, grids, geographic names, elevation contours, hydrography, and other selected map features. This map is derived from GIS (geospatial information system) data. It represents a repackaging of GIS data in traditional map form, not creation of new information. The geospatial data in this map are from selected National Map data holdings and other government sources.
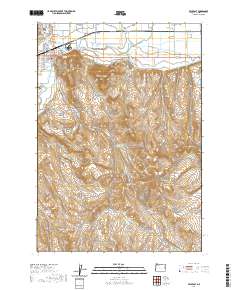
Layered geospatial PDF 7.5 Minute Quadrangle Map. Layers of geospatial data include orthoimagery, roads, grids, geographic names, elevation contours, hydrography, and other selected map features. This map is derived from GIS (geospatial information system) data. It represents a repackaging of GIS data in traditional map form, not creation of new information. The geospatial data in this map are from selected National Map data holdings and other government sources.
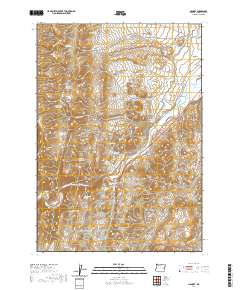
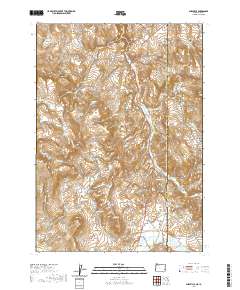
Layered geospatial PDF 7.5 Minute Quadrangle Map. Layers of geospatial data include orthoimagery, roads, grids, geographic names, elevation contours, hydrography, and other selected map features. This map is derived from GIS (geospatial information system) data. It represents a repackaging of GIS data in traditional map form, not creation of new information. The geospatial data in this map are from selected National Map data holdings and other government sources.
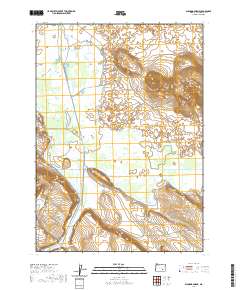
Layered geospatial PDF 7.5 Minute Quadrangle Map. Layers of geospatial data include orthoimagery, roads, grids, geographic names, elevation contours, hydrography, and other selected map features. This map is derived from GIS (geospatial information system) data. It represents a repackaging of GIS data in traditional map form, not creation of new information. The geospatial data in this map are from selected National Map data holdings and other government sources.

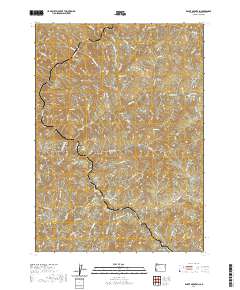
Layered geospatial PDF 7.5 Minute Quadrangle Map. Layers of geospatial data include orthoimagery, roads, grids, geographic names, elevation contours, hydrography, and other selected map features. This map is derived from GIS (geospatial information system) data. It represents a repackaging of GIS data in traditional map form, not creation of new information. The geospatial data in this map are from selected National Map data holdings and other government sources.
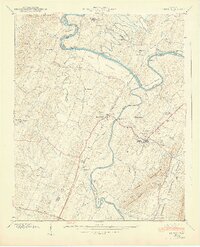
USGS Historical Quadrangle in GeoPDF.
Layered geospatial PDF 7.5 Minute Quadrangle Map. Layers of geospatial data include orthoimagery, roads, grids, geographic names, elevation contours, hydrography, and other selected map features. This map is derived from GIS (geospatial information system) data. It represents a repackaging of GIS data in traditional map form, not creation of new information. The geospatial data in this map are from selected National Map data holdings and other government sources.
Layered geospatial PDF 7.5 Minute Quadrangle Map. Layers of geospatial data include orthoimagery, roads, grids, geographic names, elevation contours, hydrography, and other selected map features. This map is derived from GIS (geospatial information system) data. It represents a repackaging of GIS data in traditional map form, not creation of new information. The geospatial data in this map are from selected National Map data holdings and other government sources.
Layered geospatial PDF 7.5 Minute Quadrangle Map. Layers of geospatial data include orthoimagery, roads, grids, geographic names, elevation contours, hydrography, and other selected map features. This map is derived from GIS (geospatial information system) data. It represents a repackaging of GIS data in traditional map form, not creation of new information. The geospatial data in this map are from selected National Map data holdings and other government sources.
These data are high-resolution bathymetry (riverbed elevation) in compressed LAS (*.laz) format, generated from the July 17–19, 2023, hydrographic survey of Bubbly Creek and various sidings, harbors, and turning basins on the Chicago Sanitary and Ship Canal (CS&SC) in Cook County, Illinois. The survey includes all Bubbly Creek from the confluence with the CS&SC in the north to the Racine Avenue Pump station in the south; various sidings and turning basins along the CS&SC between Kedzie Avenue and South Halsted Street; and the Marine Safety Station harbor near the Chicago Harbor Lock on Lake Michigan. This survey is a continuation and enhancement of the bathymetric survey of the CS&SC in Cook County, Illinois, conducted...
These data represent total vegetation and surface water along approximately 12 kilometers of the Paria River upstream from the confluence of the Colorado River at Lees Ferry, Arizona. They are derived from airborne, multispectral imagery obtained in late May 2009, 2013, and 2021, collected with a push-broom sensor with 4 spectral bands depicting Blue, Green, Red and Near-Infrared wavelengths at a spatial resolution of 20 centimeters. The vegetation classification data were created using a supervised classification algorithm provided by Harris Geospatial in ENVI version 5.6.3 (Exelis Visual Information Solutions, Boulder, Colorado). The water data were created using a Green Normalized Difference Vegetation Index...
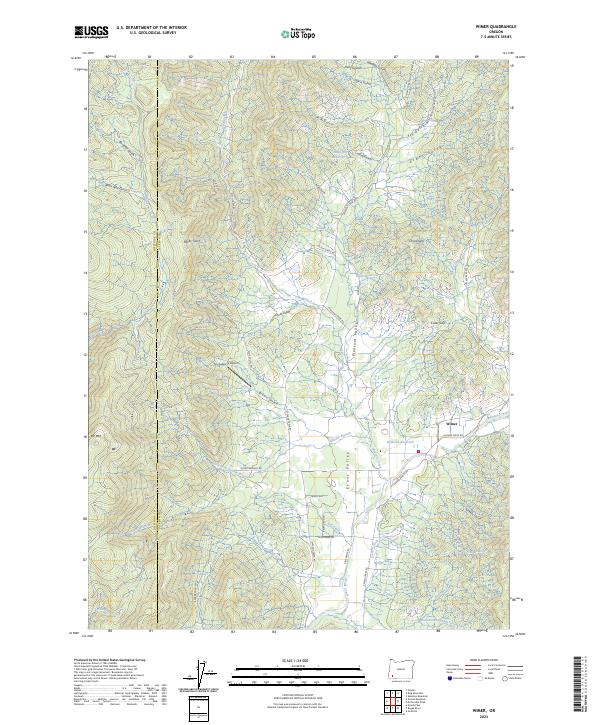
Layered geospatial PDF 7.5 Minute Quadrangle Map. Layers of geospatial data include orthoimagery, roads, grids, geographic names, elevation contours, hydrography, and other selected map features. This map is derived from GIS (geospatial information system) data. It represents a repackaging of GIS data in traditional map form, not creation of new information. The geospatial data in this map are from selected National Map data holdings and other government sources.
Layered geospatial PDF 7.5 Minute Quadrangle Map. Layers of geospatial data include orthoimagery, roads, grids, geographic names, elevation contours, hydrography, and other selected map features. This map is derived from GIS (geospatial information system) data. It represents a repackaging of GIS data in traditional map form, not creation of new information. The geospatial data in this map are from selected National Map data holdings and other government sources.
LANDFIRE's (LF) 2022 Forest Canopy Cover (CC) describes the percent cover of the tree canopy in a stand. CC is a vertical projection of the tree canopy cover onto an imaginary horizontal plane. CC supplies information for fire behavior models to determine the probability of crown fire initiation, provide input in the spotting model, calculate wind reductions, and to calculate fuel moisture conditioning. To create this product, plot level CC values are calculated using the canopy fuel estimation software, Forest Vegetation Simulator (FVS). Pre-disturbance CC and Canopy Height (CH) are used as predictors of disturbed CC using a linear regression equation per Fuel Vegetation Type (FVT), disturbance type/severity, and...
LANDFIRE (LF) 2022 Fuel Vegetation Cover (FVC) represents the LF Existing Vegetation Cover (EVC) product, modified to represent pre-disturbance EVC in areas where disturbances have occurred over the past 10 years. EVC is mapped as continuous estimates of canopy cover for tree, shrub, and herbaceous lifeforms with a potential range from 10% to 100%. Continuous EVC values are binned to align with fuel model assignments when creating FVC. FVC is an input for fuel transitions related to disturbance. Fuel products in LF 2022 were created with LF 2016 Remap vegetation in non-disturbed areas. To designate disturbed areas where FVC is modified, the aggregated Annual Disturbance products from 2013 to 2022 in the Fuel Disturbance...
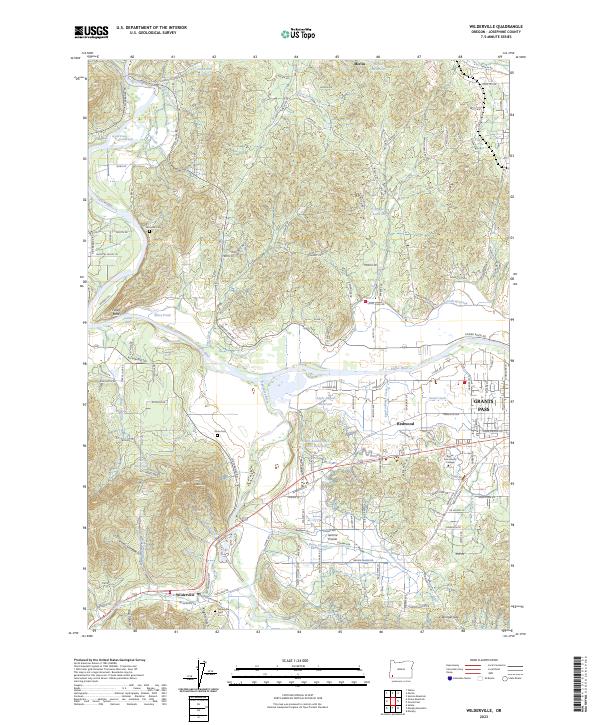
Layered geospatial PDF 7.5 Minute Quadrangle Map. Layers of geospatial data include orthoimagery, roads, grids, geographic names, elevation contours, hydrography, and other selected map features. This map is derived from GIS (geospatial information system) data. It represents a repackaging of GIS data in traditional map form, not creation of new information. The geospatial data in this map are from selected National Map data holdings and other government sources.
Layered geospatial PDF 7.5 Minute Quadrangle Map. Layers of geospatial data include orthoimagery, roads, grids, geographic names, elevation contours, hydrography, and other selected map features. This map is derived from GIS (geospatial information system) data. It represents a repackaging of GIS data in traditional map form, not creation of new information. The geospatial data in this map are from selected National Map data holdings and other government sources.
Layered geospatial PDF 7.5 Minute Quadrangle Map. Layers of geospatial data include orthoimagery, roads, grids, geographic names, elevation contours, hydrography, and other selected map features. This map is derived from GIS (geospatial information system) data. It represents a repackaging of GIS data in traditional map form, not creation of new information. The geospatial data in this map are from selected National Map data holdings and other government sources.
Layered geospatial PDF 7.5 Minute Quadrangle Map. Layers of geospatial data include orthoimagery, roads, grids, geographic names, elevation contours, hydrography, and other selected map features. This map is derived from GIS (geospatial information system) data. It represents a repackaging of GIS data in traditional map form, not creation of new information. The geospatial data in this map are from selected National Map data holdings and other government sources.
|

|
