Filters: Tags: land cover (X)
989 results (19ms)|
Filters
Date Range
Extensions Types
Contacts
Categories Tag Types
|
The US Geological Survey Chesapeake Bay Watershed Land Cover Data Series, 2011 edition, (CBLCD-e11) consists of Level I Land Cover data for the years 1984, 1992, 2001, 2006 and 2011. It consists of a series of five 8-bit unsigned integer raster data files of 30 meter spatial resolution in Albers Conic Equal Area projection, NAD83 datum. The 1984 – 2006 data layers were created by aggregating most Level II Anderson classes of the USGS CBLCD Land Cover Data Series released in 2010 (Irani and Claggett, 2010).
This data set presents attributes of floodplain ecosystem characteristics including floodplain soil denitrification, floodplain soil biogeochemistry, floodplain vegetation, floodplain sedimentation, floodplain and channel morphometry, stream discharge and water quality, floodplain climate, floodplain physiographic region, and catchment land cover. Attributes are associated with 18 floodplains of the Chesapeake Bay watershed. For many of these attributes, mean values are summaries of multiple measurements made within each floodplain site.
Categories: Data;
Tags: Maryland,
Pennsylvania,
USGS Science Data Catalog (SDC),
Virginia,
West Virginia,
This raster dataset depicts percent canopy cover derived from 1-m conifer classifications when aggregated to 30-m cells. Conifer features were classified from 2010, 2012, and 2013 NAIP Digital Ortho Quarter Quads (DOQQ) using the Feature Analyst 5.0 extension for ArcGIS 10.1. Tiles were organized and grouped by Nevada Department of Wildlife Population Management Unit (PMU) locations, plus a 10 km area beyond the PMU extent. Analysts visually identified conifers in the imagery using false color infrared settings and digitized multiple trees per tile as training locations for classification. After performing hierarchical learning and clutter removal with Feature Analyst to remove non-conifer features on output shapefiles,...
Types: Citation,
Map Service,
OGC WFS Layer,
OGC WMS Layer,
OGC WMS Service;
Tags: Biota,
Conifers,
Environment,
Great Basin,
Land cover,
Geospatial data that is a derivative land cover product depicting woodland on topographic maps.

This dataset depicts relative erosion rate derived for all land draining above the Mesoamerican reef. It is a function of slope, land cover type, precipitation and soil type. The indicators developed by the Reefs at Risk in the Caribbean project enable detailed comparative analyses of threats on many scales. The Reefs at Risk indicators are a simplification of human activities and complex natural processes. This data set was derived at the World Resources Institute for input to the sedimentation and pollution from watershed based sources threat analysis. Agriculture, though important to economic development and food security, is a source of increased sediment, nutrient, and pesticide runoff. Threats from sedimentation...

Using basins derived from a hydrologically-corrected 30m resolution DEM as a unit for summary statistics, we provide a series of indicators focused on land-based sources of threat within the US Virgin Islands and Puerto Rico. This includes indicators of a) the relative vulnerability of the land to erosion (based on slope, precipitation and soil erodibility); b) the relative erosion potential (REP) of the land, based on the relative vulnerability of the land, coupled with the current land cover type; c) the sediment delivery rate for each basin (percentage of eroded which reaches the river mouth); d) estimated sediment delivery for the basin, given current land use;
The national dataset was clipped to the WLCI envelope by USGS staff. No other processing was performed on the dataset. This map layer is commonly called Bailey's ecoregions and shows ecosystems of regional extent in the United States, Puerto Rico, and the U.S. Virgin Islands. Four levels of detail are included to show a hierarchy of ecosystems. The largest ecosystems are domains, which are groups of related climates and which are differentiated based on precipitation and temperature. Divisions represent the climates within domains and are differentiated based on precipitation levels and patterns as well as temperature. Divisions are subdivided into provinces, which are differentiated based on vegetation or other...
Categories: Data;
Types: Downloadable,
Map Service,
OGC WFS Layer,
OGC WMS Layer,
Shapefile;
Tags: acid rain,
animal/plant,
biotic,
ecosystem,
elevation,

This dataset portrays land cover for north-central Alaska, part of NLCD superzone 15. To reduce file size, Alaska was divided into ten zones, which can be found in the NLCD 2001 gallery . For more infomation on NLCD superzones, including a map, refer to http://www.mrlc.gov/nlcd_multizone_map.php . From NLCD: The National Land Cover Database 2001 was produced through a cooperative project conducted by the Multi-Resolution Land Characteristics (MRLC) Consortium. The MRLC Consortium is a partnership of federal agencies (www.mrlc.gov), consisting of the U.S. Geological Survey (USGS), the National Oceanic and Atmospheric Administration (NOAA), the U.S. Environmental Protection Agency (EPA), the U.S. Department of Agriculture...
This data file contains a list of journal articles found in a recent search for research relevant to studying landscape perceptions. We collected all peer reviewed academic articles containing the keywords “landscape” and “perception” on the web of science resulting in 3497 records. To eliminate studies not directly addressing landscape perception we filtered out medical journal articles (n=1211). We also chose to limit our assessment to journals directly concerned with the landscape perception topic, omitting those with fewer than 5 articles pertaining to these keywords (n=1044). The abstract and title of the remaining articles (n=1242) were further scanned to discard irrelevant studies and evaluate specific methods...
Categories: Data;
Tags: Geography,
Land Use Change,
USGS Science Data Catalog (SDC),
World,
land cover,
This dataset contains generalized landcover data for the Prairie Farm Rehabilitation Administration (PFRA) determined agricultural extent of Manitoba and Saskatchewan. This dataset was subset into two shapefiles. The other half of this dataset covers PFRA agricultural areas of Alberta and British Columbia. The Landcover Generalization process was undertaken to solve rendering problems of the original vectorized landcover data due to its unwieldy/overwhelming size. LANDSAT 7 imagery used in the process was collected during the WGTPP. This landcover imagery has a 30 meter resolution and is stored in over 1,100 vectorized 1:50,000 map sheet tiles. The data requires over seven gigabytes of disc space. If the user wishes...
This dataset contains a projection of land use and land cover for the conterminous United States for the period 2001 - 2061. This projection used the USGS's LUCAS (Land Use and Carbon Scenario Simulator) model to project a business as usual scenario of land cover and land use change. By running the LUCAS model on the USGS's YETI high performance computer and parallelizing the computation, we ran 100 Monte Carlo simulations based on empirically observed rates of change at a relatively fine scale (270m). We sampled from multiple observed rates of change at the county level to introduce heterogeneity into the Monte Carlo simulations. Using this approach allowed the model to project different outcomes that were summarized...

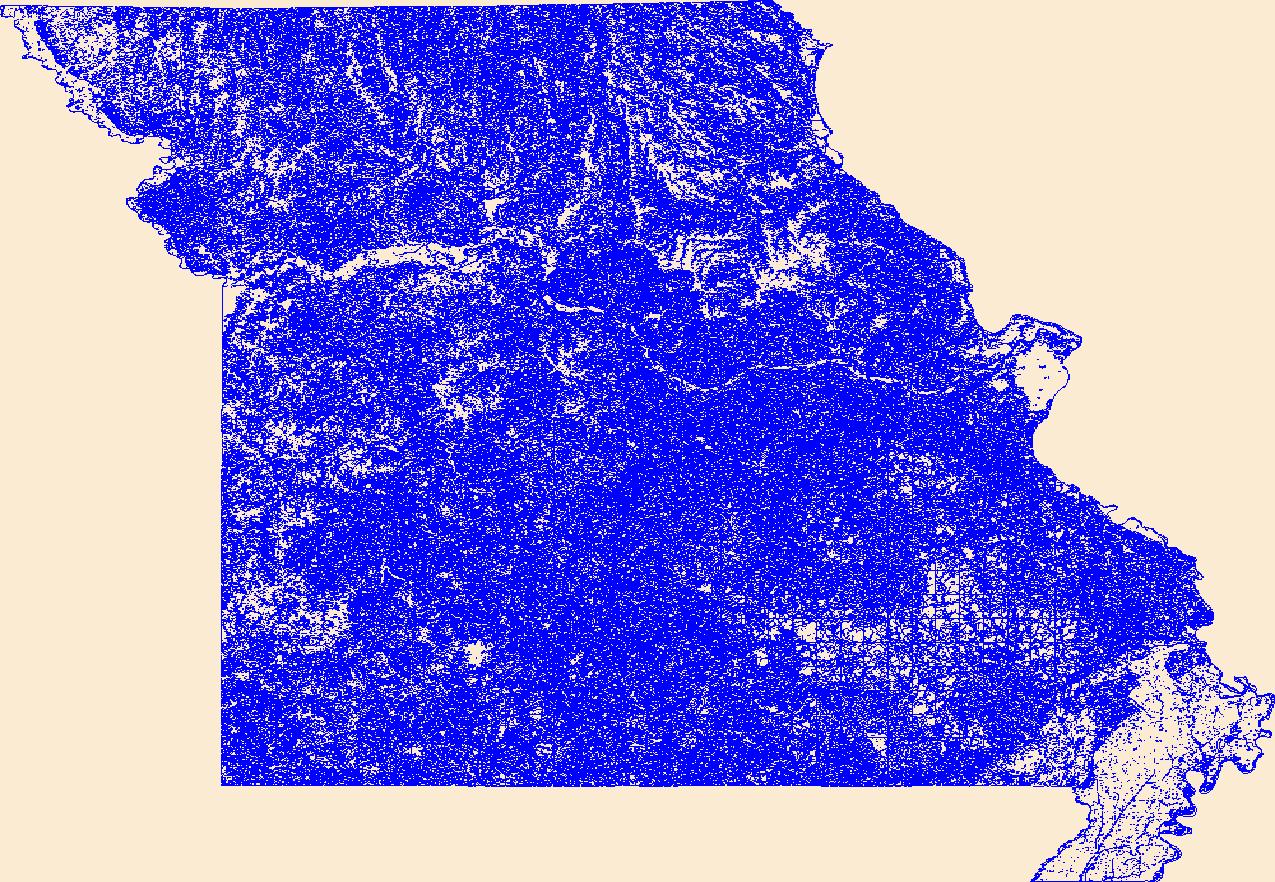
The USDA, NASS Cropland Data Layer (CDL) is a raster, geo-referenced, crop-specific land cover data layer with a ground resolution of 56 meters. The CDL is produced using satellite imagery from the Indian Remote Sensing RESOURCESAT-1 (IRS-P6) Advanced Wide Field Sensor (AWiFS) collected during the current growing season. Some Cropland Data Layer states used Landsat 5 TM and/or Landsat 7 ETM+ satellite imagery to supplement the classification. Ancillary classification inputs include: the United States Geological Survey (USGS) National Elevation Dataset (NED), the USGS National Land Cover Dataset 2001 (NLCD 2001), and the National Aeronautics and Space Administration (NASA) Moderate Resolution Imaging Spectroradiometer...

This dataset was created in order to facilitate transboundary conservation work and research projects, by integrating land cover maps into a single dataset from Cape Caution, BC, to Yakutat Bay, AK. It includes three levels of land classification, site index, elevation, hydric soils (yes/no), karst (yes/no), primary and secondary species, size class, and volume class. It also includes a number of other important attributes from individual datasets, which were not crosswalked between the different areas. This file represents Land Classification Level 2.
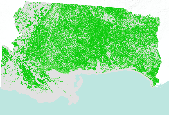
This dataset portrays percent tree canopy coverage for NLCD mapping superzone twelve (south), covering parts of Louisiana, Mississippi, Alabama, Florida, and Arkansas . Refer to http://www.mrlc.gov/nlcd_multizone_map.php for a map of the superzones. From NLCD: The National Land Cover Database 2001 was produced through a cooperative project conducted by the Multi-Resolution Land Characteristics (MRLC) Consortium. The MRLC Consortium is a partnership of federal agencies (www.mrlc.gov), consisting of the U.S. Geological Survey (USGS), the National Oceanic and Atmospheric Administration (NOAA), the U.S. Environmental Protection Agency (EPA), the U.S. Department of Agriculture (USDA), the U.S. Forest Service (USFS),...

This dataset portrays land cover for Puerto Rico, which is NLCD mapping superzone seventeen. Refer to http://www.mrlc.gov/nlcd_multizone_map.php for a map of the superzones. From NLCD: The National Land Cover Database 2001 was produced through a cooperative project conducted by the Multi-Resolution Land Characteristics (MRLC) Consortium. The MRLC Consortium is a partnership of federal agencies (www.mrlc.gov), consisting of the U.S. Geological Survey (USGS), the National Oceanic and Atmospheric Administration (NOAA), the U.S. Environmental Protection Agency (EPA), the U.S. Department of Agriculture (USDA), the U.S. Forest Service (USFS), the National Park Service (NPS), the U.S. Fish and Wildlife Service (FWS),...

This dataset portrays land cover for NLCD mapping superzone five, covering most of Arizona, a large portion of western New Mexico, and very small portions of Utah, Colorado, and Texas. Refer to http://www.mrlc.gov/nlcd_multizone_map.php for a map of the super-zones. From NLCD: The National Land Cover Database 2001 was produced through a cooperative project conducted by the Multi-Resolution Land Characteristics (MRLC) Consortium. The MRLC Consortium is a partnership of federal agencies (www.mrlc.gov), consisting of the U.S. Geological Survey (USGS), the National Oceanic and Atmospheric Administration (NOAA), the U.S. Environmental Protection Agency (EPA), the U.S. Department of Agriculture (USDA), the U.S. Forest...
Tags: land cover,
nlcd

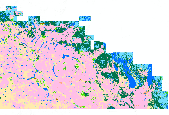
This dataset portrays percent imperviousness surface area for NLCD mapping superzone four, covering most of Utah and Colorado, and parts of Wyoming, Montana, Idaho, Nevada, Arizona, and New Mexico. Refer to http://www.mrlc.gov/nlcd_multizone_map.php for a map of the super-zones. From NLCD: The National Land Cover Database 2001 was produced through a cooperative project conducted by the Multi-Resolution Land Characteristics (MRLC) Consortium. The MRLC Consortium is a partnership of federal agencies (www.mrlc.gov), consisting of the U.S. Geological Survey (USGS), the National Oceanic and Atmospheric Administration (NOAA), the U.S. Environmental Protection Agency (EPA), the U.S. Department of Agriculture (USDA),...
Tags: impervious,
land cover

Geospatial data that is a derivative land cover product depicting woodland on topographic maps.
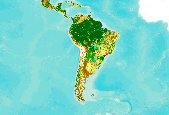
This dataset is an extract from the GlobCover 2009 land cover map, covering Central and South America. The GlobCover 2009 land cover map is derived by an automatic and regionally-tuned classification of a time series of global MERIS (MEdium Resolution Imaging Spectrometer) FR mosaics for the year 2009. The global land cover map counts 22 land cover classes defined with the United Nations (UN) Land Cover Classification System (LCCS). For more information on the GlobCover project, see http://ionia1.esrin.esa.int/ Note on display: class 210: Water Bodies is set to "transparent" to improve display in the Data Basin map. Within the extract's extent, no data were removed from the original dataset.
The National Hydro Network (NHN), for which the standard was officially adopted by the Canadian Council on Geomatics (CCOG) in August 2004, focuses on providing a quality geometric description and a set of basic attributes describing Canada's inland surface waters. It provides geospatial vector data describing hydrographic features such as lakes, reservoirs, rivers, streams, canals, islands, obstacles (e.g. waterfalls, rapids, rocks in water) and constructions (e.g. dams, wharves, dikes), as well as a linear drainage network and the toponymic information (geographical names) associated to hydrography.The NHN forms the hydrographic layer of the GeoBase. The best available federal and provincial/territorial data are...
|

|
