Filters: Tags: manitoba (X)
170 results (107ms)|
Filters
Date Range
Extensions Types
Contacts
Categories Tag Types
|
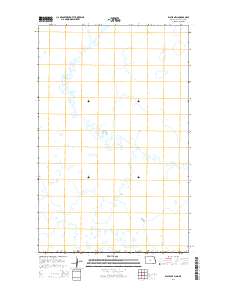
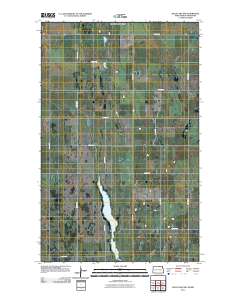
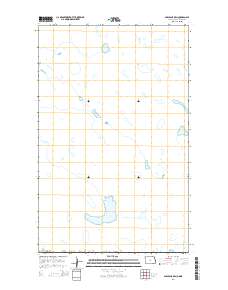
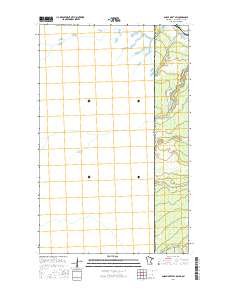
Layered GeoPDF 7.5 Minute Quadrangle Map. Layers of geospatial data include orthoimagery, roads, grids, geographic names, elevation contours, hydrography, and other selected map features.
Layered GeoPDF 7.5 Minute Quadrangle Map. Layers of geospatial data include orthoimagery, roads, grids, geographic names, elevation contours, hydrography, and other selected map features.
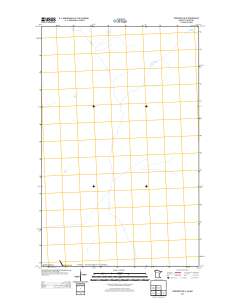
Layered GeoPDF 7.5 Minute Quadrangle Map. Layers of geospatial data include orthoimagery, roads, grids, geographic names, elevation contours, hydrography, and other selected map features.
Layered GeoPDF 7.5 Minute Quadrangle Map. Layers of geospatial data include orthoimagery, roads, grids, geographic names, elevation contours, hydrography, and other selected map features.

A three-dimensional groundwater flow model was developed to characterize groundwater resources the uppermost principal aquifers in the Williston structural basin in parts of Montana, North Dakota, and South Dakota in the United States and of Manitoba and Saskatchewan in Canada as part of a detailed assessment of the groundwater availability of the area. The uppermost principal aquifers are comprised of the glacial, lower Tertiary, and Upper Cretaceous aquifer systems. The model was developed as a part of the U.S. Geological Survey Water Availability and Use Science Program's effort to conduct large-scale multidisciplinary regional studies of groundwater availability. The numerical model is intended to be used to...
Conclusions:distance from edge and the habitat heterogeneity were the most important variables affecting bryophyte and lichen species richnessThresholds/Learnings:Temperature and light intensity decreased, and humidity increased up to 15m from the edge of fragments in the study.
Categories: Publication;
Types: Citation;
Tags: Alberta,
Land use configuration,
Landscape fragmentation,
Manitoba,
Natural cover heterogeneity,
A comprehensive study to evaluate water-quality trends in the International Souris River Basin, Saskatchewan and Manitoba, Canada and North Dakota, United States was completed by the U.S. Geological Survey (USGS) in cooperation with the International Joint Commission. This child page contains seven csv files, site_flow, which contain daily streamflow values for each site used in USGS Scientific Investigations Report 2023–5084 [Nustad, R.A., and Tatge, W.S., 2023, Comprehensive water-quality trend analysis for selected sites and constituents in the International Souris River Basin, Saskatchewan and Manitoba, Canada, and North Dakota, United States, 1970–2020: U.S. Geological Survey Scientific Investigations Report...
Comma-separated values (.csv) file containing data related to amphibian sampling across the United States between 2016 and 2021. Data files contain mercury concentrations in amphibian and dragonfly tissues, mercury concentrations in sediment, as well as amphibian morphometrics, and habitat and climate characteristics where the samples were collected.
These data represent simulated ecological drought conditions for current climate, and for future climate represented by all available climate models at two time periods during the 21st century. These data were used to: 1) describe geographic patterns in ecological drought under historical climate conditions, 2) quantify the direction and magnitude of change in ecological drought, 3) identify areas and ecological drought metrics with projected changes that are robust across climate models, defined as drought metrics and locations where >90% of climate models agree in the direction of change.

The datatset is a compilation of all permanent (legally established) protected areas in Manitoba, Canada.
File_Mapping.csv: This file relates historical reconstructed hydrology streamflow from the U.S. Army Corps of Engineers () to the appropriate stochastic streamflow file for disaggregation of streamflow. Column A is an assigned ID, column B is named “Stochastic” and is the stochastic streamflow file needed for disaggregation, column c is called “RH_Ratio_Col” and is the name of the column in the reconstructed hydrology dataset associated with a stochastic streamflow file, and column D is named “Col_Num” and is the column number in the reconstructed hydrology dataset with the name given in column C. Original_Draw_YearDat.csv: This file contains the historical year from 1930 to 2017 with the closest total streamflow...
A comprehensive study to evaluate water-quality trends in the international Red River of the North basin and to assess water-quality conditions for Red River of the North crossing the international boundary near Emerson, Manitoba was completed by the U.S. Geological Survey (USGS) in cooperation with the International Joint Commission, North Dakota Department of Environmental Quality (NDDEQ) and Minnesota Pollution Control Agency (MPCA), and in collaboration with Manitoba Sustainable Development (MSD) and Environment and Climate Change Canada (ECCC). In this dataset a zipped folder is provided which contains all files necessary to run models and produce results published in U.S. Geological Scientific Investigations...
This child page contains a zipped folder which contains all files necessary to run trend models and produce results published in U.S. Geological Scientific Investigations Report 2020–5079 [Nustad, R.A., and Vecchia, A.V., 2020, Water-quality trends for selected sites and constituents in the international Red River of the North Basin, Minnesota and North Dakota, United States, and Manitoba, Canada, 1970–2017: U.S. Geological Survey Scientific Investigations Report 2020–5079, 75 p., https://doi.org/10.3133/sir20205079]. The folder contains: six files required to run the R–QWTREND trend analysis tool; a readme.txt file; an alldata.RData file; a siteinfo_appendix.txt: and a folder called "scripts". R–QWTREND is a software...
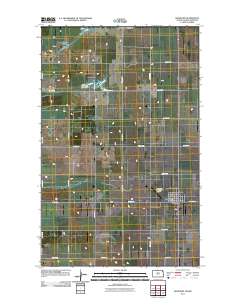
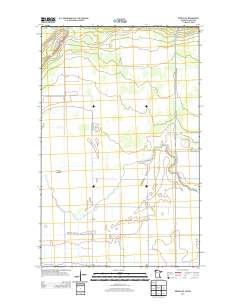
Layered GeoPDF 7.5 Minute Quadrangle Map. Layers of geospatial data include orthoimagery, roads, grids, geographic names, elevation contours, hydrography, and other selected map features.
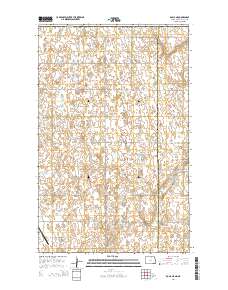
Layered GeoPDF 7.5 Minute Quadrangle Map. Layers of geospatial data include orthoimagery, roads, grids, geographic names, elevation contours, hydrography, and other selected map features.
Layered GeoPDF 7.5 Minute Quadrangle Map. Layers of geospatial data include orthoimagery, roads, grids, geographic names, elevation contours, hydrography, and other selected map features.
Layered GeoPDF 7.5 Minute Quadrangle Map. Layers of geospatial data include orthoimagery, roads, grids, geographic names, elevation contours, hydrography, and other selected map features.
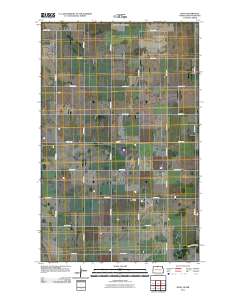
Layered GeoPDF 7.5 Minute Quadrangle Map. Layers of geospatial data include orthoimagery, roads, grids, geographic names, elevation contours, hydrography, and other selected map features.
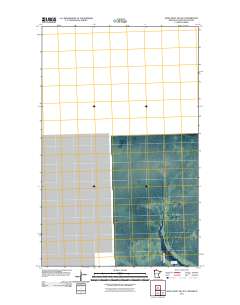
Layered GeoPDF 7.5 Minute Quadrangle Map. Layers of geospatial data include orthoimagery, roads, grids, geographic names, elevation contours, hydrography, and other selected map features.
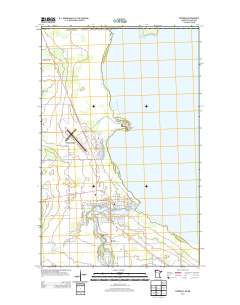
Layered GeoPDF 7.5 Minute Quadrangle Map. Layers of geospatial data include orthoimagery, roads, grids, geographic names, elevation contours, hydrography, and other selected map features.
|

|
