Filters: Tags: nawqa (X)
397 results (767ms)|
Filters
Date Range
Extensions Types
Contacts
Categories Tag Types Tag Schemes |

These data were released prior to the October 1, 2016 effective date for the USGS’s policy dictating the review, approval, and release of scientific data as referenced in USGS Survey Manual Chapter 502.8 Fundamental Science Practices: Review and Approval of Scientific Data for Release. This data set represents the area of National Resources Inventory irrigation system, tailwater recovery conservation practice, in square kilometers, in the conterminous United States. The data set was used as an input data layer for a national model to predict nitrate concentration in ground water used for drinking. Nolan and Hitt (2006) developed two national models to predict contamination of ground water by nonpoint sources of...

These data were released prior to the October 1, 2016 effective date for the USGS’s policy dictating the review, approval, and release of scientific data as referenced in USGS Survey Manual Chapter 502.8 Fundamental Science Practices: Review and Approval of Scientific Data for Release. This data set represents the amount of histosols soil taxonomic order, in percent, in the conterminous United States. The data set was used as an input data layer for a national model to predict nitrate concentration in shallow ground water. Nolan and Hitt (2006) developed two national models to predict contamination of ground water by nonpoint sources of nitrate. The nonlinear approach to national-scale Ground-WAter Vulnerability...

These data were released prior to the October 1, 2016 effective date for the USGS’s policy dictating the review, approval, and release of scientific data as referenced in USGS Survey Manual Chapter 502.8 Fundamental Science Practices: Review and Approval of Scientific Data for Release. This data set represents saturation overland flow estimated by TOPMODEL, in percent of streamflow, in the conterminous United States. The data set was used as an input data layer for a national model to predict nitrate concentration in ground water used for drinking. Nolan and Hitt (2006) developed two national models to predict contamination of ground water by nonpoint sources of nitrate. The nonlinear approach to national-scale...

These data were released prior to the October 1, 2016 effective date for the USGS’s policy dictating the review, approval, and release of scientific data as referenced in USGS Survey Manual Chapter 502.8 Fundamental Science Practices: Review and Approval of Scientific Data for Release. This data set represents "water input," the ratio of the total area of irrigated land to precipitation, in square kilometers per centimeter, in the conterminous United States. The data set was used as an input data layer for a national model to predict nitrate concentration in shallow ground water. Nolan and Hitt (2006) developed two national models to predict contamination of ground water by nonpoint sources of nitrate. The nonlinear...

These data were released prior to the October 1, 2016 effective date for the USGS’s policy dictating the review, approval, and release of scientific data as referenced in USGS Survey Manual Chapter 502.8 Fundamental Science Practices: Review and Approval of Scientific Data for Release. This data set represents 1990 block group population density, in people per square kilometer, in the conterminous United States. The data set was used as an input data layer for a national model to predict nitrate concentration in shallow ground water. Nolan and Hitt (2006) developed two national models to predict contamination of ground water by nonpoint sources of nitrate. The nonlinear approach to national-scale Ground-WAter Vulnerability...

These data were released prior to the October 1, 2016 effective date for the USGS’s policy dictating the review, approval, and release of scientific data as referenced in USGS Survey Manual Chapter 502.8 Fundamental Science Practices: Review and Approval of Scientific Data for Release. This data set represents the average annual nitrogen input from confined animal manure, 1992 and 1997, in kilograms per hectare, in the conterminous United States. The data set was used as an input data layer for a national model to predict nitrate concentration in ground water used for drinking. Nolan and Hitt (2006) developed two national models to predict contamination of ground water by nonpoint sources of nitrate. The nonlinear...

These data were released prior to the October 1, 2016 effective date for the USGS’s policy dictating the review, approval, and release of scientific data as referenced in USGS Survey Manual Chapter 502.8 Fundamental Science Practices: Review and Approval of Scientific Data for Release. This data set represents the average annual R-factor, rainfall-runoff erosivity measure, compiled for every catchment of NHDPlus for the conterminous United States. The source data are from Christopher Daly of the Spatial Climate Analysis Service, Oregon State University, and George Taylor of the Oregon Climate Service, Oregon State University (2002), who developed spatially distributed estimates of R-factor for the period 1971-2000...

These data were released prior to the October 1, 2016 effective date for the USGS’s policy dictating the review, approval, and release of scientific data as referenced in USGS Survey Manual Chapter 502.8 Fundamental Science Practices: Review and Approval of Scientific Data for Release. This dataset represents the area of each physiographic province (Fenneman and Johnson, 1946) in square meters, compiled for every catchment of NHDPlus for the conterminous United States. The source data are from Fenneman and Johnson's Physiographic Provinces of the United States, which is based on 8 major divisions, 25 provinces, and 86 sections representing distinctive areas having common topography, rock type and structure, and...

These data were released prior to the October 1, 2016 effective date for the USGS’s policy dictating the review, approval, and release of scientific data as referenced in USGS Survey Manual Chapter 502.8 Fundamental Science Practices: Review and Approval of Scientific Data for Release. This tabular data set represents the average atmospheric (wet) deposition, in kilograms per square kilometer, of inorganic nitrogen for the year 2002 compiled for every catchment for MRB_E2RF1 of Major River Basins (MRBs, Crawford and others, 2006). The source data set for wet deposition was from the USGS's raster data set atmospheric (wet) deposition of inorganic nitrogen for 2002 (Gronberg, 2005). The MRB_E2RF1 catchments are based...

This spatial data set was created by the U.S. Geological Survey (USGS) to represent the extent of arid land irrigation in the Pacific Northwest region of the United States (Hydro Region 17; Major River Basin 7 (MRB7)) during 2001.
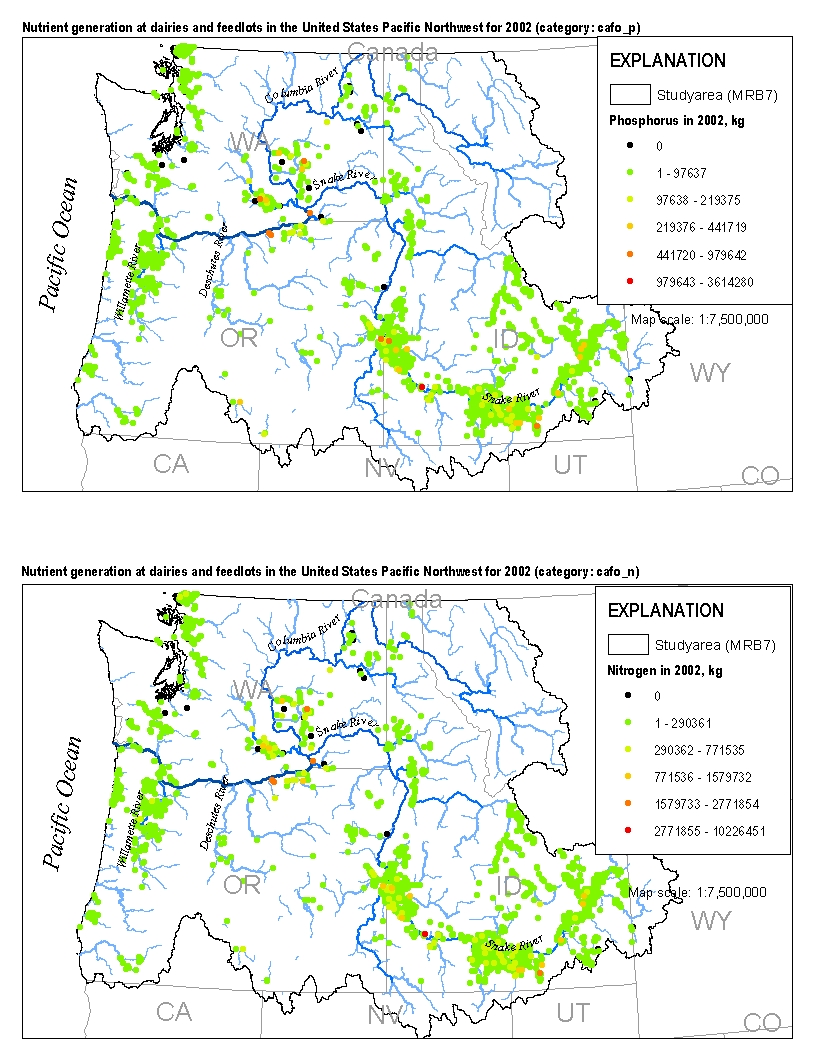
This spatial data set was created by the U.S. Geological Survey (USGS) to represent the amount of nitrogen and phosphorus generated by cattle at dairies and feedlots in the Pacific Northwest region of the United States (Hydro Region 17; Major River Basin 7 (MRB7)) during 2002.
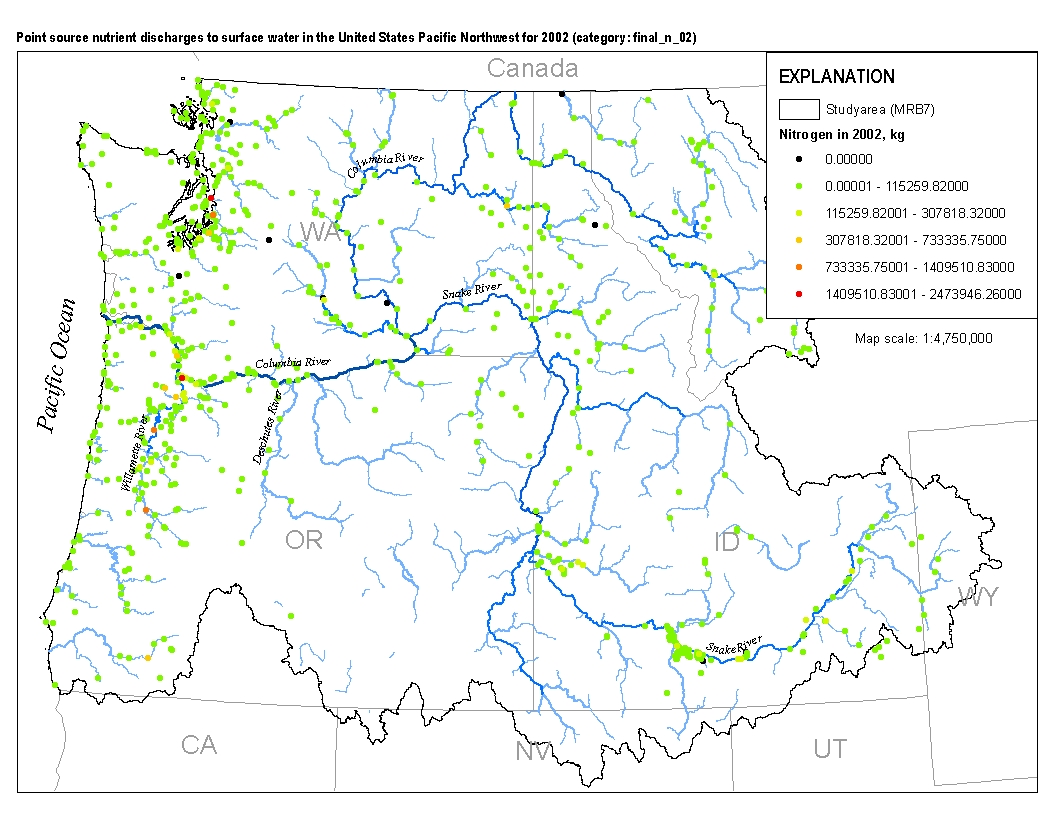
This spatial data set was created by the U.S. Geological Survey (USGS) to represent the amount of total nitrogen and total phosphorus discharged to surface waters in the Pacific Northwest region of the United States (Hydro Region 17; Major River Basin 7 (MRB7)) during 2002 from individual permitted wastewater facilities.
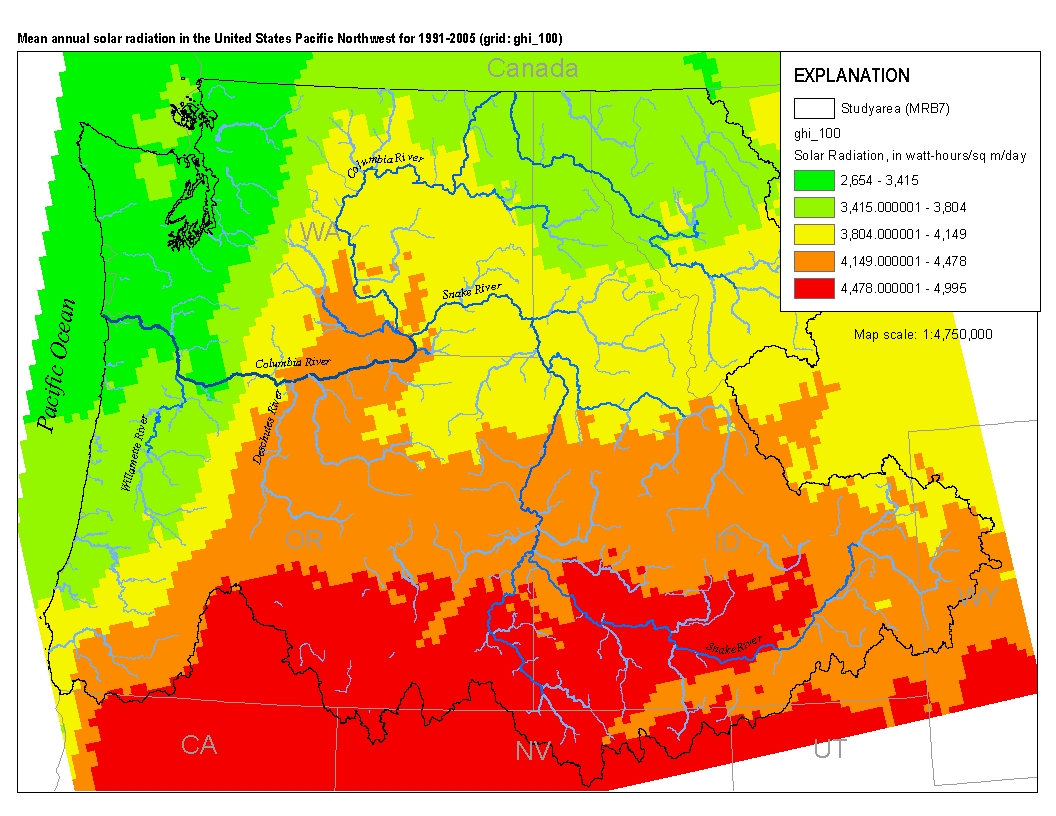
This spatial data set was created by the U.S. Geological Survey (USGS) to represent mean annual solar radiation in the Pacific Northwest region of the United States (Hydro Region 17; Major River Basin 7 (MRB7)) for the period between 1991 and 2005.
These tabular data sets represent mean monthly precipitation (millimeters) data from 800-meter PRISM data for the years 2016 and 2017 compiled for two spatial components of the NHDPlus version 2 data suite (NHDPlusv2) for the conterminous United States; 1) individual reach catchments and 2) reach catchments accumulated upstream through the river network. This dataset can be linked to the NHDPlus version 2 data suite by the unique identifier COMID. The source data for mean monthly precipitation (Celsius) from 800-meter PRISM data was produced by the PRISM Group at Oregon State University. Units are degrees Celsius. Reach catchment information characterizes data at the local scale. Reach catchments accumulated upstream...
This tabular data set represents estimated mean annual snow as a percent of total precipitation, 1905-2002 compiled for two spatial components of the NHDPlus version 2 data suite (NHDPlusv2) for the conterminous United States; 1) individual reach catchments and 2) reach catchments accumulated upstream through the river network. This dataset can be linked to the NHDPlus version 2 data suite by the unique identifier COMID. The source data for estimated mean annual snow as a percent of total precipitation was produced by the USGS (Wolock, written communic., 2012) and processed based on the methods described by McCabe and Wolock (USGS, 2009). Units are percent. Reach catchment information characterizes data at the local...
This tabular data set represents monthly average precipitation values (millimeters) described in Wolock and McCabe (2018), compiled for the NHDPlus version 2 data suite (NHDPlusV2) for the conterminous United States for the years 1945 - 2015. Linkage of the precipitation data with NHDPlusV2 is achieved through the common unique identifier COMID. The precipitation values are estimated both for: 1) individual reach catchments and 2) reach catchments accumulated upstream through the river network. The reach catchment information characterizes data at the local scale, whereas the catchments accumulated through the river network characterize cumulative upstream conditions. The network-accumulated values are derived using...
Groundwater-quality data were collected from 748 wells as part of the National Water-Quality Assessment Project of the U.S. Geological Survey National Water-Quality Program from May 2012 through December 2013. The data were collected from four types of well networks: principal aquifer study networks, which assess the quality of groundwater used for public water supply; land-use study networks, which assess land-use effects on shallow groundwater quality; major aquifer study networks, which assess the quality of groundwater used for domestic supply; and enhanced trends networks, which evaluate the time scales during which groundwater quality changes. Groundwater samples were analyzed for a large number of water-quality...
Inferences drawn from regional bioassessments could be strengthened by integrating data from different monitoring programs. We combined data from the US Geological Survey National Water-Quality Assessment (NAWQA) program and the US Environmental Protection Agency Wadeable Streams Assessment (WSA) to expand the scope of an existing River InVertebrate Prediction and Classification System (RIVPACS)?type predictive model and to assess the biological condition of streams across the western US in a variety of landuse classes. We used model-derived estimates of taxon-specific probabilities of capture and observed taxon occurrences to identify taxa that were absent from sites where they were predicted to occur (decreasers)...
Categories: Publication;
Types: Citation,
Journal Citation;
Tags: Journal of the North American Benthological Society,
NAWQA,
North American Benthological Society,
O/E,
WSA,
High radium (Ra) concentrations in potable portions of the Cambrian-Ordovician (C-O) aquifer system were investigated using water-quality data and environmental tracers ( 3H, 3Hetrit, SF6 , 14C and 4Herad) of groundwater age from 80 public-supply wells (PSWs). Groundwater ages were estimated by calibration of tracers to lumped parameter models and ranged from modern (1 Myr) in the most downgradient, confined portions of the potable system. More than 80 and 40 percent of mean groundwater ages were older than 1000 and 50,000 yr, respectively. Anoxic, Fe-reducing conditions and increased mineralization develop with time in the aquifer system and mobilize Ra into solution resulting in the frequent occurrence of combined...
This data release consists of data (in four tables) for assessing the time scales of arsenic variability in three production wells in New Hampshire; tables that describe the data fields in the data tables are also included in the data release. High-frequency (every 5 to 15 minutes) and bi-monthly water-quality monitoring of a bedrock-aquifer domestic well (425651070573701), a bedrock-aquifer public-supply well (425400070545401), and a glacial-aquifer public-supply well (425311070535801) was completed between 2014 and 2018. Concentrations of arsenic and other geochemical constituents and dissolved gases, as tracers of groundwater age, were measured on a bimonthly basis; physicochemical data, including specific conductance,...
|

|
