Filters: Tags: normal (X)
38 results (55ms)|
Filters
Date Range
Extensions (Less) Types (Less)
Contacts (Less)
Categories (Less) Tag Types Tag Schemes |
This set of 4 rasters shows precipitation as snow (mm) for Western North America under the B1 Emissions Scenario from the Intergovernmental Panel on Climate Change (IPCC). One layer shows the historic period (1961 to 1990), and there are three layers of future climate projections representing the 2020s, the 2050s, and the 2080s. These future layers are ensemble averages across all 23 CMIP3 AOGCMs (Coupled Model Intercomparison Project 3 Atmosphere-Ocean General Circulation Models). All layers have a resolution of 1 km, and are designed to capture climate gradients, temperature inversions, and rain shadows in the mountainous landscape of western North America. These data, originally published here, were converted...
Categories: Data;
Types: ArcGIS REST Map Service,
ArcGIS Service Definition,
Downloadable,
Map Service;
Tags: 2020s,
2050s,
2080s,
B1,
ClimateWNA,
This set of 4 rasters shows winter (Dec to Feb) mean temperature (deg C * 10) for Western North America under the A1B Emissions Scenario from the Intergovernmental Panel on Climate Change (IPCC). One layer shows the historic period (1961 to 1990), and there are three layers of future climate projections representing the 2020s, the 2050s, and the 2080s. These future layers are ensemble averages across all 23 CMIP3 AOGCMs (Coupled Model Intercomparison Project 3 Atmosphere-Ocean General Circulation Models). All layers have a resolution of 1 km, and are designed to capture climate gradients, temperature inversions, and rain shadows in the mountainous landscape of western North America. These data, originally published...
Categories: Data;
Types: ArcGIS REST Map Service,
ArcGIS Service Definition,
Downloadable,
Map Service;
Tags: 2020s,
2050s,
2080s,
A1B,
ClimateWNA,
Tax brackets are a common feature of non-renewable resource taxes. Although the introduction of brackets would seem to be an innocuous way of approximating a non-linear tax system, the dynamic effects are surprising. This paper shows that the presence of tax brackets in both a severance tax system and a profits tax system can induce the extractive firm to depart from the well-known monotonically declining extraction profile and to choose instead a profile which has constant extraction rates over some interval of time.
This set of 4 rasters shows mean temperature of the coldest month (deg C * 10) for Western North America under the B1 Emissions Scenario from the Intergovernmental Panel on Climate Change (IPCC). One layer shows the historic period (1961 to 1990), and there are three layers of future climate projections representing the 2020s, the 2050s, and the 2080s. These future layers are ensemble averages across all 23 CMIP3 AOGCMs (Coupled Model Intercomparison Project 3 Atmosphere-Ocean General Circulation Models). All layers have a resolution of 1 km, and are designed to capture climate gradients, temperature inversions, and rain shadows in the mountainous landscape of western North America. These data, originally published...
Categories: Data;
Types: ArcGIS REST Map Service,
ArcGIS Service Definition,
Downloadable,
Map Service;
Tags: 2020s,
2050s,
2080s,
B1,
ClimateWNA,
This set of 4 rasters shows summer (Jun to Aug) mean temperature (deg C * 10) for Western North America under the A1B Emissions Scenario from the Intergovernmental Panel on Climate Change (IPCC). One layer shows the historic period (1961 to 1990), and there are three layers of future climate projections representing the 2020s, the 2050s, and the 2080s. These future layers are ensemble averages across all 23 CMIP3 AOGCMs (Coupled Model Intercomparison Project 3 Atmosphere-Ocean General Circulation Models). All layers have a resolution of 1 km, and are designed to capture climate gradients, temperature inversions, and rain shadows in the mountainous landscape of western North America. These data, originally published...
Categories: Data;
Types: ArcGIS REST Map Service,
ArcGIS Service Definition,
Downloadable,
Map Service;
Tags: 2020s,
2050s,
2080s,
A1B,
ClimateWNA,
This set of 4 rasters shows mean summer (May to Sep) precipitation (mm) for Western North America under the B1 Emissions Scenario from the Intergovernmental Panel on Climate Change (IPCC). One layer shows the historic period (1961 to 1990), and there are three layers of future climate projections representing the 2020s, the 2050s, and the 2080s. These future layers are ensemble averages across all 23 CMIP3 AOGCMs (Coupled Model Intercomparison Project 3 Atmosphere-Ocean General Circulation Models). All layers have a resolution of 1 km, and are designed to capture climate gradients, temperature inversions, and rain shadows in the mountainous landscape of western North America. These data, originally published here,...
Categories: Data;
Types: ArcGIS REST Map Service,
ArcGIS Service Definition,
Downloadable,
Map Service;
Tags: 2020s,
2050s,
2080s,
B1,
ClimateWNA,
Societal concerns about the social and environmental impacts of biofuel production are driving producers to adopt better management practices. Existing certification schemes for sustainable biofuel production are, however, biased towards industrial-scale producers that have the financial capital and economies of scale to meet sustainability and certification objectives. Smallholder farmers in developing countries, by contrast, often lack the means and capacity to do so. Some of the challenges faced by smallholders include high certification costs, insufficient institutional capacity, inadequate financial and social incentives, poor group organization and lack of external support. Drawing lessons from existing certification...
This set of 4 rasters shows mean annual temperature (deg C * 10) for Western North America under the A1B Emissions Scenario from the Intergovernmental Panel on Climate Change (IPCC). One layer shows the historic period (1961 to 1990), and there are three layers of future climate projections representing the 2020s, the 2050s, and the 2080s. These future layers are ensemble averages across all 23 CMIP3 AOGCMs (Coupled Model Intercomparison Project 3 Atmosphere-Ocean General Circulation Models). All layers have a resolution of 1 km, and are designed to capture climate gradients, temperature inversions, and rain shadows in the mountainous landscape of western North America. These data, originally published here, were...
Categories: Data;
Types: ArcGIS REST Map Service,
ArcGIS Service Definition,
Downloadable,
Map Service;
Tags: 2020s,
2050s,
2080s,
A1B,
ClimateWNA,
This set of 4 rasters shows summer (Jun to Aug) precipitation (mm) for Western North America under the B1 Emissions Scenario from the Intergovernmental Panel on Climate Change (IPCC). One layer shows the historic period (1961 to 1990), and there are three layers of future climate projections representing the 2020s, the 2050s, and the 2080s. These future layers are ensemble averages across all 23 CMIP3 AOGCMs (Coupled Model Intercomparison Project 3 Atmosphere-Ocean General Circulation Models). All layers have a resolution of 1 km, and are designed to capture climate gradients, temperature inversions, and rain shadows in the mountainous landscape of western North America. These data, originally published here, were...
Categories: Data;
Types: ArcGIS REST Map Service,
ArcGIS Service Definition,
Downloadable,
Map Service;
Tags: 2020s,
2050s,
2080s,
B1,
ClimateWNA,
This set of 4 rasters shows winter (Dec to Feb) precipitation (mm) for Western North America under the B1 Emissions Scenario from the Intergovernmental Panel on Climate Change (IPCC). One layer shows the historic period (1961 to 1990), and there are three layers of future climate projections representing the 2020s, the 2050s, and the 2080s. These future layers are ensemble averages across all 23 CMIP3 AOGCMs (Coupled Model Intercomparison Project 3 Atmosphere-Ocean General Circulation Models). All layers have a resolution of 1 km, and are designed to capture climate gradients, temperature inversions, and rain shadows in the mountainous landscape of western North America. These data, originally published here, were...
Categories: Data;
Types: ArcGIS REST Map Service,
ArcGIS Service Definition,
Downloadable,
Map Service;
Tags: 2020s,
2050s,
2080s,
B1,
ClimateWNA,
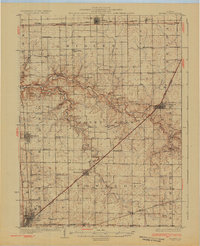
USGS Historical Quadrangle in GeoPDF.
This set of 4 rasters shows summer (Jun to Aug) precipitation (mm) for Western North America under the A1B Emissions Scenario from the Intergovernmental Panel on Climate Change (IPCC). One layer shows the historic period (1961 to 1990), and there are three layers of future climate projections representing the 2020s, the 2050s, and the 2080s. These future layers are ensemble averages across all 23 CMIP3 AOGCMs (Coupled Model Intercomparison Project 3 Atmosphere-Ocean General Circulation Models). All layers have a resolution of 1 km, and are designed to capture climate gradients, temperature inversions, and rain shadows in the mountainous landscape of western North America. These data, originally published here,...
Categories: Data;
Types: ArcGIS REST Map Service,
ArcGIS Service Definition,
Downloadable,
Map Service;
Tags: 2020s,
2050s,
2080s,
A1B,
ClimateWNA,
This set of 4 rasters shows winter (Dec to Feb) precipitation (mm) for Western North America under the A2 Emissions Scenario from the Intergovernmental Panel on Climate Change (IPCC). One layer shows the historic period (1961 to 1990), and there are three layers of future climate projections representing the 2020s, the 2050s, and the 2080s. These future layers are ensemble averages across all 23 CMIP3 AOGCMs (Coupled Model Intercomparison Project 3 Atmosphere-Ocean General Circulation Models). All layers have a resolution of 1 km, and are designed to capture climate gradients, temperature inversions, and rain shadows in the mountainous landscape of western North America. These data, originally published here, were...
Categories: Data;
Types: ArcGIS REST Map Service,
ArcGIS Service Definition,
Downloadable,
Map Service;
Tags: 2020s,
2050s,
2080s,
A2,
ClimateWNA,
This set of 4 rasters shows mean temperature of the coldest month (deg C * 10) for Western North America under the A2 Emissions Scenario from the Intergovernmental Panel on Climate Change (IPCC). One layer shows the historic period (1961 to 1990), and there are three layers of future climate projections representing the 2020s, the 2050s, and the 2080s. These future layers are ensemble averages across all 23 CMIP3 AOGCMs (Coupled Model Intercomparison Project 3 Atmosphere-Ocean General Circulation Models). All layers have a resolution of 1 km, and are designed to capture climate gradients, temperature inversions, and rain shadows in the mountainous landscape of western North America. These data, originally published...
Categories: Data;
Types: ArcGIS REST Map Service,
ArcGIS Service Definition,
Downloadable,
Map Service;
Tags: 2020s,
2050s,
2080s,
A2,
ClimateWNA,
This set of 4 rasters shows mean annual temperature (deg C * 10) for Western North America under the B1 Emissions Scenario from the Intergovernmental Panel on Climate Change (IPCC). One layer shows the historic period (1961 to 1990), and there are three layers of future climate projections representing the 2020s, the 2050s, and the 2080s. These future layers are ensemble averages across all 23 CMIP3 AOGCMs (Coupled Model Intercomparison Project 3 Atmosphere-Ocean General Circulation Models). All layers have a resolution of 1 km, and are designed to capture climate gradients, temperature inversions, and rain shadows in the mountainous landscape of western North America. These data, originally published here, were...
Categories: Data;
Types: ArcGIS REST Map Service,
ArcGIS Service Definition,
Downloadable,
Map Service;
Tags: 2020s,
2050s,
2080s,
B1,
ClimateWNA,
This set of 4 rasters shows mean annual precipitation (mm) for Western North America under the A1B Emissions Scenario from the Intergovernmental Panel on Climate Change (IPCC). One layer shows the historic period (1961 to 1990), and there are three layers of future climate projections representing the 2020s, the 2050s, and the 2080s. These future layers are ensemble averages across all 23 CMIP3 AOGCMs (Coupled Model Intercomparison Project 3 Atmosphere-Ocean General Circulation Models). All layers have a resolution of 1 km, and are designed to capture climate gradients, temperature inversions, and rain shadows in the mountainous landscape of western North America. These data, originally published here, were converted...
Categories: Data;
Types: ArcGIS REST Map Service,
ArcGIS Service Definition,
Downloadable,
Map Service;
Tags: 2020s,
2050s,
2080s,
A1B,
ClimateWNA,
This set of 4 rasters shows mean summer (May to Sep) precipitation (mm) for Western North America under the A2 Emissions Scenario from the Intergovernmental Panel on Climate Change (IPCC). One layer shows the historic period (1961 to 1990), and there are three layers of future climate projections representing the 2020s, the 2050s, and the 2080s. These future layers are ensemble averages across all 23 CMIP3 AOGCMs (Coupled Model Intercomparison Project 3 Atmosphere-Ocean General Circulation Models). All layers have a resolution of 1 km, and are designed to capture climate gradients, temperature inversions, and rain shadows in the mountainous landscape of western North America. These data, originally published here,...
Categories: Data;
Types: ArcGIS REST Map Service,
ArcGIS Service Definition,
Downloadable,
Map Service;
Tags: 2020s,
2050s,
2080s,
A2,
ClimateWNA,
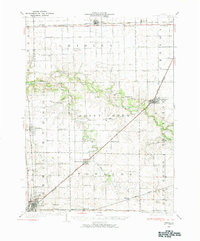
USGS Historical Quadrangle in GeoPDF.
This set of 4 rasters shows mean temperature of the warmest month (deg C * 10) for Western North America under the A1B Emissions Scenario from the Intergovernmental Panel on Climate Change (IPCC). One layer shows the historic period (1961 to 1990), and there are three layers of future climate projections representing the 2020s, the 2050s, and the 2080s. These future layers are ensemble averages across all 23 CMIP3 AOGCMs (Coupled Model Intercomparison Project 3 Atmosphere-Ocean General Circulation Models). All layers have a resolution of 1 km, and are designed to capture climate gradients, temperature inversions, and rain shadows in the mountainous landscape of western North America. These data, originally published...
Categories: Data;
Types: ArcGIS REST Map Service,
ArcGIS Service Definition,
Downloadable,
Map Service;
Tags: 2020s,
2050s,
2080s,
A1B,
ClimateWNA,
This set of 4 rasters shows winter (Dec to Feb) mean temperature (deg C * 10) for Western North America under the B1 Emissions Scenario from the Intergovernmental Panel on Climate Change (IPCC). One layer shows the historic period (1961 to 1990), and there are three layers of future climate projections representing the 2020s, the 2050s, and the 2080s. These future layers are ensemble averages across all 23 CMIP3 AOGCMs (Coupled Model Intercomparison Project 3 Atmosphere-Ocean General Circulation Models). All layers have a resolution of 1 km, and are designed to capture climate gradients, temperature inversions, and rain shadows in the mountainous landscape of western North America. These data, originally published...
Categories: Data;
Types: ArcGIS REST Map Service,
ArcGIS Service Definition,
Downloadable,
Map Service;
Tags: 2020s,
2050s,
2080s,
B1,
ClimateWNA,
|

|
