Filters: Tags: normal (X)
68 results (49ms)|
Filters
Date Range
Extensions Types
Contacts
Categories Tag Types Tag Schemes |

This set of 4 rasters shows mean temperature of the warmest month (deg C * 10) for Western North America under the B1 Emissions Scenario from the Intergovernmental Panel on Climate Change (IPCC). One layer shows the historic period (1961 to 1990), and there are three layers of future climate projections representing the 2020s, the 2050s, and the 2080s. These future layers are ensemble averages across all 23 CMIP3 AOGCMs (Coupled Model Intercomparison Project 3 Atmosphere-Ocean General Circulation Models). All layers have a resolution of 1 km, and are designed to capture climate gradients, temperature inversions, and rain shadows in the mountainous landscape of western North America.
This set of 4 rasters shows winter (Dec to Feb) precipitation (mm) for Western North America under the B1 Emissions Scenario from the Intergovernmental Panel on Climate Change (IPCC). One layer shows the historic period (1961 to 1990), and there are three layers of future climate projections representing the 2020s, the 2050s, and the 2080s. These future layers are ensemble averages across all 23 CMIP3 AOGCMs (Coupled Model Intercomparison Project 3 Atmosphere-Ocean General Circulation Models). All layers have a resolution of 1 km, and are designed to capture climate gradients, temperature inversions, and rain shadows in the mountainous landscape of western North America.
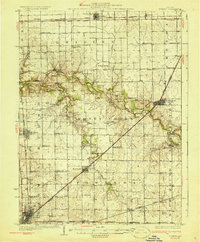
USGS Historical Quadrangle in GeoPDF.
This set of 4 rasters shows summer (Jun to Aug) precipitation (mm) for Western North America under the A2 Emissions Scenario from the Intergovernmental Panel on Climate Change (IPCC). One layer shows the historic period (1961 to 1990), and there are three layers of future climate projections representing the 2020s, the 2050s, and the 2080s. These future layers are ensemble averages across all 23 CMIP3 AOGCMs (Coupled Model Intercomparison Project 3 Atmosphere-Ocean General Circulation Models). All layers have a resolution of 1 km, and are designed to capture climate gradients, temperature inversions, and rain shadows in the mountainous landscape of western North America. These data, originally published here, were...
Categories: Data;
Types: ArcGIS REST Map Service,
ArcGIS Service Definition,
Downloadable,
Map Service;
Tags: 2020s,
2050s,
2080s,
A2,
ClimateWNA,
This set of 4 rasters shows summer (Jun to Aug) mean temperature (deg C * 10) for Western North America under the B1 Emissions Scenario from the Intergovernmental Panel on Climate Change (IPCC). One layer shows the historic period (1961 to 1990), and there are three layers of future climate projections representing the 2020s, the 2050s, and the 2080s. These future layers are ensemble averages across all 23 CMIP3 AOGCMs (Coupled Model Intercomparison Project 3 Atmosphere-Ocean General Circulation Models). All layers have a resolution of 1 km, and are designed to capture climate gradients, temperature inversions, and rain shadows in the mountainous landscape of western North America. These data, originally published...
Categories: Data;
Types: ArcGIS REST Map Service,
ArcGIS Service Definition,
Downloadable,
Map Service;
Tags: 2020s,
2050s,
2080s,
B1,
ClimateWNA,

This set of 4 rasters shows mean temperature of the warmest month (deg C * 10) for Western North America under the A1B Emissions Scenario from the Intergovernmental Panel on Climate Change (IPCC). One layer shows the historic period (1961 to 1990), and there are three layers of future climate projections representing the 2020s, the 2050s, and the 2080s. These future layers are ensemble averages across all 23 CMIP3 AOGCMs (Coupled Model Intercomparison Project 3 Atmosphere-Ocean General Circulation Models). All layers have a resolution of 1 km, and are designed to capture climate gradients, temperature inversions, and rain shadows in the mountainous landscape of western North America.
Most dryland fanning systems depend an tillage to grow crops. There is overwhelming evidence that repeated tillage is destroying the soil resource base and causing adverse environmental impacts. Tillage degrades the fertility of soils, causes air and water pollution, intensifies drought stress, destroys wildlife habitat, wastes fuel energy, and contributes to global warming. Consequently, most tillage-based systems in a dryland environment are not sustainable in the long-term. Today, dryland farmers are expected to produce food in ever greater quantities. This is becoming more difficult to do in view of declining soil quality, most of which is caused by soil tillage. It is becoming well documented scientifically...

This set of 4 rasters shows winter (Dec to Feb) precipitation (mm) for Western North America under the A2 Emissions Scenario from the Intergovernmental Panel on Climate Change (IPCC). One layer shows the historic period (1961 to 1990), and there are three layers of future climate projections representing the 2020s, the 2050s, and the 2080s. These future layers are ensemble averages across all 23 CMIP3 AOGCMs (Coupled Model Intercomparison Project 3 Atmosphere-Ocean General Circulation Models). All layers have a resolution of 1 km, and are designed to capture climate gradients, temperature inversions, and rain shadows in the mountainous landscape of western North America.
This set of 4 rasters shows mean temperature of the warmest month (deg C * 10) for Western North America under the B1 Emissions Scenario from the Intergovernmental Panel on Climate Change (IPCC). One layer shows the historic period (1961 to 1990), and there are three layers of future climate projections representing the 2020s, the 2050s, and the 2080s. These future layers are ensemble averages across all 23 CMIP3 AOGCMs (Coupled Model Intercomparison Project 3 Atmosphere-Ocean General Circulation Models). All layers have a resolution of 1 km, and are designed to capture climate gradients, temperature inversions, and rain shadows in the mountainous landscape of western North America. These data, originally published...
Categories: Data;
Types: ArcGIS REST Map Service,
ArcGIS Service Definition,
Downloadable,
Map Service;
Tags: 2020s,
2050s,
2080s,
B1,
ClimateWNA,
This set of 4 rasters shows winter (Dec to Feb) mean temperature (deg C * 10) for Western North America under the A2 Emissions Scenario from the Intergovernmental Panel on Climate Change (IPCC). One layer shows the historic period (1961 to 1990), and there are three layers of future climate projections representing the 2020s, the 2050s, and the 2080s. These future layers are ensemble averages across all 23 CMIP3 AOGCMs (Coupled Model Intercomparison Project 3 Atmosphere-Ocean General Circulation Models). All layers have a resolution of 1 km, and are designed to capture climate gradients, temperature inversions, and rain shadows in the mountainous landscape of western North America. These data, originally published...
Categories: Data;
Types: ArcGIS REST Map Service,
ArcGIS Service Definition,
Downloadable,
Map Service;
Tags: 2020s,
2050s,
2080s,
A2,
ClimateWNA,

This set of 4 rasters shows summer (Jun to Aug) mean temperature (deg C * 10) for Western North America under the B1 Emissions Scenario from the Intergovernmental Panel on Climate Change (IPCC). One layer shows the historic period (1961 to 1990), and there are three layers of future climate projections representing the 2020s, the 2050s, and the 2080s. These future layers are ensemble averages across all 23 CMIP3 AOGCMs (Coupled Model Intercomparison Project 3 Atmosphere-Ocean General Circulation Models). All layers have a resolution of 1 km, and are designed to capture climate gradients, temperature inversions, and rain shadows in the mountainous landscape of western North America.
This set of 4 rasters shows mean summer (May to Sep) precipitation (mm) for Western North America under the A1B Emissions Scenario from the Intergovernmental Panel on Climate Change (IPCC). One layer shows the historic period (1961 to 1990), and there are three layers of future climate projections representing the 2020s, the 2050s, and the 2080s. These future layers are ensemble averages across all 23 CMIP3 AOGCMs (Coupled Model Intercomparison Project 3 Atmosphere-Ocean General Circulation Models). All layers have a resolution of 1 km, and are designed to capture climate gradients, temperature inversions, and rain shadows in the mountainous landscape of western North America. These data, originally published here,...
Categories: Data;
Types: ArcGIS REST Map Service,
ArcGIS Service Definition,
Downloadable,
Map Service;
Tags: 2020s,
2050s,
2080s,
A1B,
ClimateWNA,
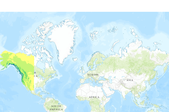
Mean Annual Precipitation under the B1 Emissions Scenario (Western North America, 23 AOGCM Ensemble)
This set of 4 rasters shows mean annual precipitation (mm) for Western North America under the B1 Emissions Scenario from the Intergovernmental Panel on Climate Change (IPCC). One layer shows the historic period (1961 to 1990), and there are three layers of future climate projections representing the 2020s, the 2050s, and the 2080s. These future layers are ensemble averages across all 23 CMIP3 AOGCMs (Coupled Model Intercomparison Project 3 Atmosphere-Ocean General Circulation Models). All layers have a resolution of 1 km, and are designed to capture climate gradients, temperature inversions, and rain shadows in the mountainous landscape of western North America. These data, originally published here, were converted...
Categories: Data;
Types: ArcGIS REST Map Service,
ArcGIS Service Definition,
Downloadable,
Map Service;
Tags: 2020s,
2050s,
2080s,
B1,
ClimateWNA,

This set of 4 rasters shows mean temperature of the coldest month (deg C * 10) for Western North America under the A1B Emissions Scenario from the Intergovernmental Panel on Climate Change (IPCC). One layer shows the historic period (1961 to 1990), and there are three layers of future climate projections representing the 2020s, the 2050s, and the 2080s. These future layers are ensemble averages across all 23 CMIP3 AOGCMs (Coupled Model Intercomparison Project 3 Atmosphere-Ocean General Circulation Models). All layers have a resolution of 1 km, and are designed to capture climate gradients, temperature inversions, and rain shadows in the mountainous landscape of western North America.
Mean Annual Precipitation under the A2 Emissions Scenario (Western North America, 23 AOGCM Ensemble)
This set of 4 rasters shows mean annual precipitation (mm) for Western North America under the A2 Emissions Scenario from the Intergovernmental Panel on Climate Change (IPCC). One layer shows the historic period (1961 to 1990), and there are three layers of future climate projections representing the 2020s, the 2050s, and the 2080s. These future layers are ensemble averages across all 23 CMIP3 AOGCMs (Coupled Model Intercomparison Project 3 Atmosphere-Ocean General Circulation Models). All layers have a resolution of 1 km, and are designed to capture climate gradients, temperature inversions, and rain shadows in the mountainous landscape of western North America. These data, originally published here, were converted...
Categories: Data;
Types: ArcGIS REST Map Service,
ArcGIS Service Definition,
Downloadable,
Map Service;
Tags: 2020s,
2050s,
2080s,
A2,
ClimateWNA,
This set of 4 rasters shows winter (Dec to Feb) precipitation (mm) for Western North America under the A1B Emissions Scenario from the Intergovernmental Panel on Climate Change (IPCC). One layer shows the historic period (1961 to 1990), and there are three layers of future climate projections representing the 2020s, the 2050s, and the 2080s. These future layers are ensemble averages across all 23 CMIP3 AOGCMs (Coupled Model Intercomparison Project 3 Atmosphere-Ocean General Circulation Models). All layers have a resolution of 1 km, and are designed to capture climate gradients, temperature inversions, and rain shadows in the mountainous landscape of western North America. These data, originally published here,...
Categories: Data;
Types: ArcGIS REST Map Service,
ArcGIS Service Definition,
Downloadable,
Map Service;
Tags: 2020s,
2050s,
2080s,
A1B,
ClimateWNA,
This set of 4 rasters shows mean annual temperature (deg C * 10) for Western North America under the A2 Emissions Scenario from the Intergovernmental Panel on Climate Change (IPCC). One layer shows the historic period (1961 to 1990), and there are three layers of future climate projections representing the 2020s, the 2050s, and the 2080s. These future layers are ensemble averages across all 23 CMIP3 AOGCMs (Coupled Model Intercomparison Project 3 Atmosphere-Ocean General Circulation Models). All layers have a resolution of 1 km, and are designed to capture climate gradients, temperature inversions, and rain shadows in the mountainous landscape of western North America. These data, originally published here, were...
Categories: Data;
Types: ArcGIS REST Map Service,
ArcGIS Service Definition,
Downloadable,
Map Service;
Tags: 2020s,
2050s,
2080s,
A2,
ClimateWNA,

This set of 4 rasters shows precipitation as snow (mm) for Western North America under the B1 Emissions Scenario from the Intergovernmental Panel on Climate Change (IPCC). One layer shows the historic period (1961 to 1990), and there are three layers of future climate projections representing the 2020s, the 2050s, and the 2080s. These future layers are ensemble averages across all 23 CMIP3 AOGCMs (Coupled Model Intercomparison Project 3 Atmosphere-Ocean General Circulation Models). All layers have a resolution of 1 km, and are designed to capture climate gradients, temperature inversions, and rain shadows in the mountainous landscape of western North America.

Mean Annual Precipitation under the B1 Emissions Scenario (Western North America, 23 AOGCM Ensemble)
This set of 4 rasters shows mean annual precipitation (mm) for Western North America under the B1 Emissions Scenario from the Intergovernmental Panel on Climate Change (IPCC). One layer shows the historic period (1961 to 1990), and there are three layers of future climate projections representing the 2020s, the 2050s, and the 2080s. These future layers are ensemble averages across all 23 CMIP3 AOGCMs (Coupled Model Intercomparison Project 3 Atmosphere-Ocean General Circulation Models). All layers have a resolution of 1 km, and are designed to capture climate gradients, temperature inversions, and rain shadows in the mountainous landscape of western North America.

This set of 4 rasters shows mean summer (May to Sep) precipitation (mm) for Western North America under the A1B Emissions Scenario from the Intergovernmental Panel on Climate Change (IPCC). One layer shows the historic period (1961 to 1990), and there are three layers of future climate projections representing the 2020s, the 2050s, and the 2080s. These future layers are ensemble averages across all 23 CMIP3 AOGCMs (Coupled Model Intercomparison Project 3 Atmosphere-Ocean General Circulation Models). All layers have a resolution of 1 km, and are designed to capture climate gradients, temperature inversions, and rain shadows in the mountainous landscape of western North America.
|

|
