Filters: Tags: prism (X)
263 results (30ms)|
Filters
Contacts
(Less)
|

MC1 is a dynamic vegetation model for estimating the distribution of vegetation and associated ecosystem fluxes of carbon, nutrients, and water. It was created to assess the potential impacts of global climate change on ecosystem structure and function at a wide range of spatial scales from landscape to global. The model incorporates transient dynamics to make predictions about the patterns of ecological change. MC1 was created by combining physiologically based biogeographic rules defined in the MAPSS model with a modified version of the biogeochemical model, CENTURY. MC1 includes a fire module, MCFIRE, that mechanistically simulates the occurrence and impacts of fire events. Climate input data sources for this...

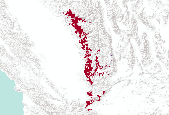
The Nature Conservancy (TNC) has derived climate suitability forecasts for most species of trees and shrubs considered to be ecological dominants of terrestrial Californian habitat types. Our plant projections are compiled as decision support tools to help Conservancy project staff, as well as our external partners, develop the necessary plans, priorities and strategies to successfully adapt to uncertain changes in future climate. In the recently completed Southern Sierra Partnership's 2010 Climate-Adapted Conservation Plan for the Southern Sierra Nevada and Tehachapi Mountains, species and habitat forecasts shown here informed the development of a regional conservation design that explicitly incorporates long-term...
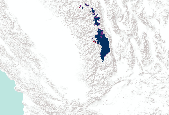
The Nature Conservancy (TNC) has derived climate suitability forecasts for most species of trees and shrubs considered to be ecological dominants of terrestrial Californian habitat types. Our plant projections are compiled as decision support tools to help Conservancy project staff, as well as our external partners, develop the necessary plans, priorities and strategies to successfully adapt to uncertain changes in future climate. In the recently completed Southern Sierra Partnership's 2010 Climate-Adapted Conservation Plan for the Southern Sierra Nevada and Tehachapi Mountains, species and habitat forecasts shown here informed the development of a regional conservation design that explicitly incorporates long-term...

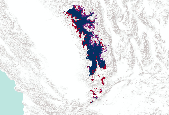
The Nature Conservancy (TNC) has derived climate suitability forecasts for most species of trees and shrubs considered to be ecological dominants of terrestrial Californian habitat types. Our plant projections are compiled as decision support tools to help Conservancy project staff, as well as our external partners, develop the necessary plans, priorities and strategies to successfully adapt to uncertain changes in future climate. In the recently completed Southern Sierra Partnership's 2010 Climate-Adapted Conservation Plan for the Southern Sierra Nevada and Tehachapi Mountains, species and habitat forecasts shown here informed the development of a regional conservation design that explicitly incorporates long-term...

This map represents the change between 1971-2000 and 2070-2099 in the mean annual fraction of each gridcell affected by fire, as simulated by the model MC1 under the Hadley future climate projection and A2 anthropogenic emissions scenario. Data values are calculated as PART_BURN(2070-2099) minus PART_BURN(1971-2000). PART_BURN data is from MC1 version B60. The average annual fraction of cell burned for the respective 30-year periods increased in some of the 5,311 grid cells of the Apache-Sitgreaves study area and decreased in others. The range of data values is from -0.077 to +0.163. The mean value is +0.031. The vegetation model MC1 (e.g. Bachelet et al. 2001) was used to simulate vegetation dynamics, associated...

MC1 is a dynamic vegetation model for estimating the distribution of vegetation and associated ecosystem fluxes of carbon, nutrients, and water. It was created to assess the potential impacts of global climate change on ecosystem structure and function at a wide range of spatial scales from landscape to global. The model incorporates transient dynamics to make predictions about the patterns of ecological change. MC1 was created by combining physiologically based biogeographic rules defined in the MAPSS model with a modified version of the biogeochemical model, CENTURY. MC1 includes a fire module, MCFIRE, that mechanistically simulates the occurrence and impacts of fire events. Climate input data sources for this...

This map represents the change between 1971-2000 and 2071-2100 in the annual peak fraction of total live vegetation carbon held in herbaceous plants, as simulated by the model MC1 under the CSIRO Mk3 future climate projection and A2 anthropogenic emissions scenario. The range of data values is from -0.741 to +0.999. The mean value is +0.107. Data values are calculated as GFRAC(2071-2100) minus GFRAC(1971-2000). GFRAC data is from MC1 version B60. The dynamic global vegetation model MC1 (e.g. Bachelet et al. 2001) was used to simulate vegetation dynamics, associated carbon and nitrogen cycle, water budget, and wild fire impacts at two study sites in eastern Oregon (Deschutes and Fremont-Winema National Forests)...
PRISM climate data for Wyoming. Data can be accessed through the Geospatial Data Gateway http://datagateway.nrcs.usda.gov/.
Categories: Data;
Types: Downloadable;
Tags: PRISM,
Precipitation,
Wyoming,
climate,
climatologyMeteorologyAtmosphere,

This map represents the percent change in total ecosystem carbon from 1971-2000 to 2070-2099, simulated by the model MC1 under the Hadley future climate projection and A2 anthropogenic emissions scenario. The average annual value of total ecosystem carbon for the respective 30-year periods decreased in some of the 5,311 grid cells of the Eastern Oregon study area and increased in others.The range of data values is from -18.2% to +194.1%. The mean value is -78.0% The vegetation model MC1 (e.g. Bachelet et al. 2001) was used to simulate vegetation dynamics, associated carbon and nitrogen cycle, water budget, and wild fire impacts at two study sites, one in eastern Oregon (Deschutes and Fremont-Winema National Forests)...

This map represents the difference in annual minimum temperatures, simulated by the model MC1 between the 30-year periods 1971-2000 and 2070-2099, using the Hadley future climate projection under the A2 anthropogenic emission scenario. The average annual minimum temperature for the respective 30-year periods increased in all of the 5,311 grid cells of the Apache-Sitgreaves study area. The greatest increase was 4.35 C; the least increase was 4.26 C; and the mean increase was 4.31 C. The vegetation model MC1 (e.g. Bachelet et al. 2001) was used to simulate vegetation dynamics, associated carbon and nitrogen cycle, water budget, and wild fire impacts at two study sites in eastern Oregon (Deschutes and Fremont-Winema...

This map represents the mean for the 30 year period 1971-2000 of the annual peak value of the fraction of live vegetation carbon which is in herbaceous (as opposed to woody) vegetation. The data is from output variable GFRAC in MC1 version B60. The data values are unitless fractions and range from 0 to 1. The vegetation model MC1 (e.g. Bachelet et al. 2001) was used to simulate vegetation dynamics, associated carbon and nitrogen cycle, water budget, and wild fire impacts at two study sites in eastern Oregon (Deschutes and Fremont-Winema National Forests) and in Arizona (Apache Sitgreaves National Forest area) in the context of a project funded by the USDA Forest Service (PNW 09-JV-11261900-003). Historical climate...

This data was produced by MC1 version B41, using historical climate from the PRISM group at OSU.

This dataset corresponds to statistically downscaled and reprojected GCM-driven RegCM3 (regional climate model) future projections. Data were bias corrected using the delta/anomaly method whereby the difference between future and historical projections from RegCM3 were calculated, reprojected and downscaled using linear interpolation to then modify a PRISM model generated historical baseline (1968-1999).

This data was produced by MC1 version B41, under the MIROC A2 future climate scenario.

This dataset depicts the Difference of Summer Precipitation for 2045-2060 compared to 1968-1999 for GFDL. These data have been generated using a regional climate model called RegCM3 using boundary conditions from observations or general circulation models for historical conditions, and from GCM projections for future conditions. Regional climate model description: RegCM3 is the third generation of the Regional Climate Model originally developed at the National Center for Atmospheric Research during the late 1980s and early 1990s. Details on current model components and applications of the model can be found in numerous publications (e.g., Giorgi et al, 2004a,b, Pal et al, 2007), the ICTP RegCNET web site (http://users.ictp.it/RegCNET/model.html),...

This map represents the mean annual value of total ecosystem carbon, simulated by the model MC1 for the 30-year period 1971-2000. The data is from output variable C_ECOSYS in MC1 version B60. The data is in units of grams of carbon per square meter; values range from 6739 to 77570 g C m-2. The mean value is 35184 g C m-2. The dynamic global vegetation model MC1 (e.g. Bachelet et al. 2001) was used to simulate vegetation dynamics, associated carbon and nitrogen cycle, water budget, and wild fire impacts at two study sites in eastern Oregon (Deschutes and Fremont-Winema National Forests) and in Arizona (Apache Sitgreaves National Forest area) in the context of a project funded by the USDA Forest Service (PNW 09-JV-11261900-003)....

The Nature Conservancy (TNC) has derived climate suitability forecasts for most species of trees and shrubs considered to be ecological dominants of terrestrial Californian habitat types. Our plant projections are compiled as decision support tools to help Conservancy project staff, as well as our external partners, develop the necessary plans, priorities and strategies to successfully adapt to uncertain changes in future climate. In the recently completed Southern Sierra Partnership's 2010 Climate-Adapted Conservation Plan for the Southern Sierra Nevada and Tehachapi Mountains, species and habitat forecasts shown here informed the development of a regional conservation design that explicitly incorporates long-term...
The Nature Conservancy (TNC) has derived climate suitability forecasts for most species of trees and shrubs considered to be ecological dominants of terrestrial Californian habitat types. Our plant projections are compiled as decision support tools to help Conservancy project staff, as well as our external partners, develop the necessary plans, priorities and strategies to successfully adapt to uncertain changes in future climate. In the recently completed Southern Sierra Partnership's 2010 Climate-Adapted Conservation Plan for the Southern Sierra Nevada and Tehachapi Mountains, species and habitat forecasts shown here informed the development of a regional conservation design that explicitly incorporates long-term...
The Nature Conservancy (TNC) has derived climate suitability forecasts for most species of trees and shrubs considered to be ecological dominants of terrestrial Californian habitat types. Our plant projections are compiled as decision support tools to help Conservancy project staff, as well as our external partners, develop the necessary plans, priorities and strategies to successfully adapt to uncertain changes in future climate. In the recently completed Southern Sierra Partnership's 2010 Climate-Adapted Conservation Plan for the Southern Sierra Nevada and Tehachapi Mountains, species and habitat forecasts shown here informed the development of a regional conservation design that explicitly incorporates long-term...

The Nature Conservancy (TNC) has derived climate suitability forecasts for most species of trees and shrubs considered to be ecological dominants of terrestrial Californian habitat types. Our plant projections are compiled as decision support tools to help Conservancy project staff, as well as our external partners, develop the necessary plans, priorities and strategies to successfully adapt to uncertain changes in future climate. In the recently completed Southern Sierra Partnership's 2010 Climate-Adapted Conservation Plan for the Southern Sierra Nevada and Tehachapi Mountains, species and habitat forecasts shown here informed the development of a regional conservation design that explicitly incorporates long-term...
|

|
