Filters: Tags: productivity (X) > partyWithName: Phil Nott, The Institute for Bird Populations (X)
9 results (79ms)|
Filters
Date Range
Tag Schemes |

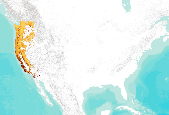
Pacific-slope Flycatcher station lifetime productivity (STAPI) (log transformed) ranged between -0.034 and +0.606 with a mean value of +0.286 and a median value of +0.247. ________________________________________ Model 1 (3 parameters) Pacific-slope Flycatcher station lifetime productivity (STAPI) (log transformed) was a function of: a) INTERCEPT (0.3022), b) NLCD06AF90P (+0.01874) - percent all forest cover, 90m-resolution(3x aggregation of 30m-resolution), ranged between -1.901 and +6.011 (95% CL) with a mean value of +2.055 and a median value of +2.494, c) NLCD06IM33P (-0.02730) - percent impervious cover, 990m-resolution (33x aggregation of 30m-resolution), ranged between -1.057 and +5.084 (95% CL) with...
Introduction : Swainson’s Thrush is a medium sized (15-18cm) thrush which prefers to breed in dense shrub growth associated with spruce-fir forests. The "russet-backed" race prefers mixed forests and deciduous riparian woodlands of the coastal region from British Columbia, to northern California. These Pacific populations winter in mature tropical and secondary forests of Central America, whereas the "olive-backed" race that breeds in the Boreal and Rockies winters in S. America. Models of Monitoring Avian Productivity and Survival (MAPS) demographic data and high-resolution land cover data showed that Swainson’s Thrush prefers large intact forest patches with low perimeter to area ratios. On a regional...

Distribution of Acadian Flycatcher productivity at MAPS stations during the period 1992-2008 throughout Midwestern states (plus 250km buffer).

Models of Monitoring Avian Productivity and Survival (MAPS) demographic data and high-resolution land cover data The top selected model of productivity indices suggested that productivity indices increased with distance from streams, where local coniferous forest cover (2km context) increased from 10 and 25% (mean `17%), within total forest cover of ~20% in a 2km context (N = 84, R2 = 0.26, P<0.0001). MacGillivray's Warbler station lifetime productivity (STAPI) (log transformed) ranged between +0.090 and +0.564 with a mean value of +0.327 and a median value of +0.325. ________________________________________ Model 1 (3 parameters) MacGillivray's Warbler station lifetime productivity (STAPI) (log transformed)...
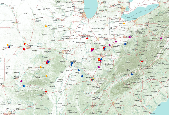
Distribution of Kentucky Warbler productivity at MAPS stations during the period 1992-2008 throughout Midwestern states (plus 250km buffer).

Distribution of Willow Flycatcher productivity at MAPS stations during the period 1992-2008 throughout Midwestern states (plus 250km buffer).

Wood Thrush station lifetime productivity (STAPI) (log transformed) ranged between -0.016 and +0.435 with a mean value of +0.210 and a median value of +0.190. ________________________________________ Model 1 (3 parameters) Wood Thrush station lifetime productivity (STAPI) (log transformed) was a function of: a) INTERCEPT (0.19951), b) NLCD06AG33P (+0.02430) - percent agricultural/grassland cover, 990m-resolution (33x aggregation of 30m-resolution), ranged between -1.143 and +4.989 (95% CL) with a mean value of +1.923 and a median value of +2.338, c) DIST2RIV15 (-0.04755) - distance (m) to stream, ranged between -0.114 and +1.654 (95% CL) with a mean value of +0.770 and a median value of +0.749. This model...

Distribution of Worm-eating Warbler productivity at MAPS stations during the period 1992-2008 throughout Midwestern states (plus 250km buffer).

Models of Monitoring Avian Productivity and Survival (MAPS) demographic data and high-resolution land cover data showed that Yellow Warbler prefers open canopy (nlcd06cc33), small gaps (nlcd06ag33), less dense streams (streamnet33) STAPI = productivity of YWARat each MAPS monitoring station calculated as the ratio of the total number of individual (i.e. uniquely banded) hatch year individuals to adult individuals STAPI = 0.6735763 + (-0.004447 * "nlcd01cc33") + (-0.004311 * "strmnet33") + (-0.00032 * "nlcd06ag33") Definitions of these parameters and how they were derived can be found in www.birdpop.org/downloaddocuments/PNW_Landscape_Analysis.pdf
|

|
