Filters: Tags: projections (X)
108 results (45ms)|
Filters
Date Range
Extensions Types Contacts
Categories Tag Types
|

Soil residual water corresponds to the model variable "total streamflow." In the model MC1, this is calculated (in cm of water) as the water flowing through the soil profile below the last soil layer (streamflow), water leached into the subsoil (baseflow) and also includes runoff. The output is presented here as a monthly average. Soil residual water is part of the model output from Brendan Rogers' MS thesis work. Brendan used the vegetation model MC1 to simulate vegetation dynamics, associated carbon and nitrogen cycle, water budget and wild fire impacts across the western 2/3 of the states of Oregon and Washington using climate input data from the PRISM group (Chris Daly, OSU) at a 30arc second (800m) spatial...

For his MS thesis, Brendan Rogers used the vegetation model MC1 to simulate vegetation dynamics, associated carbon and nitrogen cycle, water budget and wild fire impacts across the western 2/3 of the states of Oregon and Washington using climate input data from the PRISM group (Chris Daly, OSU) at a 30arc second (800m) spatial grain. The model was run from 1895 to 2100 assuming that nitrogen demand from the plants was always met so that the nitrogen concentrations in various plant parts never dropped below their minimum reported values. A CO2 enhancement effect increased productivity and water use efficiency as the atmospheric CO2 concentration increased. Future climate change scenarios were generated through statistical...
The purpose of this study was to develop land use projections for the middle of the next century. To separate the influence of climate change from other factors on land use, projections (a Central Projection and two variants) were made under both unchanged and changed climate. They cover the plausible range of alternative land claims of agriculture and urbanization. Impacts of climate change on land suitability as well as overall changes in the acreages of several land use categories are presented.

For his MS thesis, Brendan Rogers used climate data from the PRISM group (Chris Daly, Oregon State University) at a 30arc second (800m) spatial grain across the western 2/3 of the states of Oregon and Washington (USA) to generate a climatology or baseline. He then created future climate change scenarios using statistical downscaling to create anomalies from three General Circulation Models (CSIRO Mk3, MIROC 3.2 medres, and Hadley CM 3), each run through three CO2 emission scenarios (SRES B1, A1B, and A2).
Projected peak instantaneous rate of green-up date and spring scale across Wyoming from 2000 to 2099
These data represent projections of peak instantaneous rate of green-up date (PIRGd) and spring scale across Wyoming from 2000-2099. Annual data is provided in gridded time series at ~4 km spatial resolution. Projections were generated by applying linear mixed models to contemporary remote sensing data, and applying model parameters to future climate projection data from the MACA dataset. Projections were generated for 5 global climate models (GCMs) and 2 representative concentration pathway (RCP) scenarios: RCP 4.5 and RCP 8.5. Data starting in 2000 are provided to help assess accuracy of model projections against contemporary datasets, and provide a platform for comparison to projections for future years. These...
FY2016This project will evaluate the effects of vegetation treatments on population connectivity, genetic diversity and gene flow of wildlife species across the full extent of the Great Basin LCC. The recently approved BLM and Forest Service Land Use Plan Amendments will implement millions of acres of treatments in support of greater sage-grouse conservation. It is essential to evaluate the potential benefits and risks of these treatments on the connectivity and fragmentation of the landscape for multiple non-target species. We will use a dynamic landscape model to simulate fire and treatments, allowing each to vary by type (e.g., juniper removal, prescribed fire), extent, and influence on vegetation and fuels....
Categories: Data,
Project;
Types: Map Service,
OGC WFS Layer,
OGC WMS Layer,
OGC WMS Service;
Tags: Academics & scientific researchers,
Applications and Tools,
CA1,
CA1,
CA1,
The USGS RCMAP (Rangeland Condition Monitoring Assessment and Projection) project has worked with BLM scientists and land managers to develop actionable remote-sensing based vegetation classifications. RCMAP quantifies the percent cover of rangeland components across the western U.S. using Landsat imagery from 1985-2024. The RCMAP product suite consists of ten fractional components: annual herbaceous, bare ground, herbaceous, litter, non-sagebrush shrub, perennial herbaceous, sagebrush, shrub, shrub height, and tree, in addition to the temporal trends of each component. Several enhancements were made to the RCMAP process relative to prior generations. The mapping area included eight regions which were subsequently...
Types: Map Service,
OGC WFS Layer,
OGC WMS Layer,
OGC WMS Service;
Tags: RCMAP,
back-in-time,
climate change,
grassland change,
projections,
This project was designed to use climate models to produce projections of changes in sea temperatures and ocean chemistry for coastal marine areas in Micronesia as well as reports that describe the outlook of culturally important marine sites in Guam and CNMI. The projections and maps were expected show what the current state of climate science suggests the future holds for marine areas in Micronesia if we continue to use fossil fuels aggressively. These projections of sea conditions will become the foundation of outlook reports for Tumon Bay in Guam, Lao Lao Bay and Saipan Lagoon in Saipan, and northern Tinian Island. The selected areas are among the most important sites for recreation in Guam and CNMI and, as...
Categories: Project;
Types: Map Service,
OGC WFS Layer,
OGC WMS Layer,
OGC WMS Service;
Tags: 2015,
CASC,
Completed,
Coral Reefs,
Coral Reefs,
OPTIONS model- post processing- of structural stages, stand age, and Northern Spotted Owl (NSO) habitat index at years 0, 10, 20, 30, 40, 50, 100 for the Salem Sustained Yield Unit (SYU) portion of the Western Oregon Plan Revision (WOPR) area. *See Appendix R of the Western Oregon Plan Revision Proposed Resource Managemnt Plan for further description.BLM (Bureau of Land Management) WOPR (Western Oregon Plan Revision) WOPR Theme Group: OPT (Options) WOPR Purpose: O (Options) GLUA: General Land Use Allocations PRMP: Proposed Resource Management Plan ASQ (Allowable Sale Quantity) SYU (Sustained Yield Unit) ESC (Existing Stand Condition) M4C WPR_ID (a unique identifier generated in the options harvest model preparation...
OPTIONS model- post processing- of structural stages, stand age, and Northern Spotted Owl (NSO) habitat index at years 0, 10, 20, 30, 40, 50, 100 for the Medford Sustained Yield Unit (SYU) portion of the Western Oregon Plan Revision (WOPR) area. *See Appendix R of the Western Oregon Plan Revision Proposed Resource Managemnt Plan for further description.BLM (Bureau of Land Management) WOPR (Western Oregon Plan Revision) WOPR Theme Group: OPT (Options) WOPR Purpose: O (Options) GLUA: General Land Use Allocations PRMP: Proposed Resource Management Plan ASQ (Allowable Sale Quantity) SYU (Sustained Yield Unit) ESC (Existing Stand Condition) M4C WPR_ID (a unique identifier generated in the options harvest model preparation...
For his MS thesis, Brendan Rogers used the vegetation model MC1 to simulate vegetation dynamics, associated carbon and nitrogen cycle, water budget and wild fire impacts across the western 2/3 of the states of Oregon and Washington using climate input data from the PRISM group (Chris Daly, OSU) at a 30arc second (800m) spatial grain. The model was run from 1895 to 2100 assuming that nitrogen demand from the plants was always met so that the nitrogen concentrations in various plant parts never dropped below their minimum reported values. A CO2 enhancement effect increased productivity and water use efficiency as the atmospheric CO2 concentration increased. Future climate change scenarios were generated through statistical...

For his MS thesis, Brendan Rogers used the vegetation model MC1 to simulate vegetation dynamics, associated carbon and nitrogen cycle, water budget and wild fire impacts across the western 2/3 of the states of Oregon and Washington using climate input data from the PRISM group (Chris Daly, OSU) at a 30arc second (800m) spatial grain. The model was run from 1895 to 2100 assuming that nitrogen demand from the plants was always met so that the nitrogen concentrations in various plant parts never dropped below their minimum reported values. A CO2 enhancement effect increased productivity and water use efficiency as the atmospheric CO2 concentration increased. Future climate change scenarios were generated through statistical...
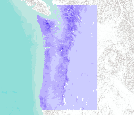
Soil residual water corresponds to the model variable "total streamflow." In the model MC1, this is calculated (in cm of water) as the water flowing through the soil profile below the last soil layer (streamflow), water leached into the subsoil (baseflow) and also includes runoff. The output is presented here as a monthly average. Soil residual water is part of the model output from Brendan Rogers' MS thesis work. Brendan used the vegetation model MC1 to simulate vegetation dynamics, associated carbon and nitrogen cycle, water budget and wild fire impacts across the western 2/3 of the states of Oregon and Washington using climate input data from the PRISM group (Chris Daly, OSU) at a 30arc second (800m) spatial...

Soil residual water corresponds to the model variable "total streamflow." In the model MC1, this is calculated (in cm of water) as the water flowing through the soil profile below the last soil layer (streamflow), water leached into the subsoil (baseflow) and also includes runoff. The output is presented here as a monthly average. Soil residual water is part of the model output from Brendan Rogers' MS thesis work. Brendan used the vegetation model MC1 to simulate vegetation dynamics, associated carbon and nitrogen cycle, water budget and wild fire impacts across the western 2/3 of the states of Oregon and Washington using climate input data from the PRISM group (Chris Daly, OSU) at a 30arc second (800m) spatial...
For his MS thesis, Brendan Rogers used the vegetation model MC1 to simulate vegetation dynamics, associated carbon and nitrogen cycle, water budget and wild fire impacts across the western 2/3 of the states of Oregon and Washington using climate input data from the PRISM group (Chris Daly, OSU) at a 30arc second (800m) spatial grain. The model was run from 1895 to 2100 assuming that nitrogen demand from the plants was always met so that the nitrogen concentrations in various plant parts never dropped below their minimum reported values. A CO2 enhancement effect increased productivity and water use efficiency as the atmospheric CO2 concentration increased. Future climate change scenarios were generated through statistical...
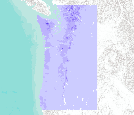
Soil residual water corresponds to the model variable "total streamflow." In the model MC1, this is calculated (in cm of water) as the water flowing through the soil profile below the last soil layer (streamflow), water leached into the subsoil (baseflow) and also includes runoff. The output is presented here as a monthly average. Soil residual water is part of the model output from Brendan Rogers' MS thesis work. Brendan used the vegetation model MC1 to simulate vegetation dynamics, associated carbon and nitrogen cycle, water budget and wild fire impacts across the western 2/3 of the states of Oregon and Washington using climate input data from the PRISM group (Chris Daly, OSU) at a 30arc second (800m) spatial...

Soil residual water corresponds to the model variable "total streamflow"." In the model MC1, this is calculated (in cm of water) as the water flowing through the soil profile below the last soil layer (streamflow), water leached into the subsoil (baseflow) and also includes runoff. The output is presented here as a monthly average. Soil residual water is part of the model output from Brendan Rogers' MS thesis work. Brendan used the vegetation model MC1 to simulate vegetation dynamics, associated carbon and nitrogen cycle, water budget and wild fire impacts across the western 2/3 of the states of Oregon and Washington using climate input data from the PRISM group (Chris Daly, OSU) at a 30arc second (800m) spatial...

Soil residual water corresponds to the model variable "total streamflow." In the model MC1, this is calculated (in cm of water) as the water flowing through the soil profile below the last soil layer (streamflow), water leached into the subsoil (baseflow) and also includes runoff. The output is presented here as a monthly average. Soil residual water is part of the model output from Brendan Rogers' MS thesis work. Brendan used the vegetation model MC1 to simulate vegetation dynamics, associated carbon and nitrogen cycle, water budget and wild fire impacts across the western 2/3 of the states of Oregon and Washington using climate input data from the PRISM group (Chris Daly, OSU) at a 30arc second (800m) spatial...
This research focuses on understanding the rates, causes, and consequences of land change across a range of geographic and temporal scales. Our emphasis is on developing alternative future projections and quantifying the impact on environmental systems, in particular, the role of land-use change on ecosystem carbon dynamics. This project supports the development of the Land-use and Carbon Scenario Simulator (LUCAS) model. LUCAS tracks changes in land use, land cover, land management, and disturbance, and their impacts on ecosystem carbon storage and flux by combining: A State-and-Transition Simulation Model (STSM) to simulate changes in land-use across a range of geographic scales. A Stock and Flow Model to track...
Categories: Project;
Types: Map Service,
OGC WFS Layer,
OGC WMS Layer,
OGC WMS Service;
Tags: California,
Carbon flux,
Carbon stock,
Conterminous United States,
Hawaii,

For his MS thesis, Brendan Rogers used climate data from the PRISM group (Chris Daly, Oregon State University) at a 30arc second (800m) spatial grain across the western 2/3 of the states of Oregon and Washington (USA) to generate a climatology or baseline. He then created future climate change scenarios using statistical downscaling to create anomalies from three General Circulation Models (CSIRO Mk3, MIROC 3.2 medres, and Hadley CM 3), each run through three CO2 emission scenarios (SRES B1, A1B, and A2).
|

|
